Paraguayan vs Immigrants from Uganda Female Disability
COMPARE
Paraguayan
Immigrants from Uganda
Female Disability
Female Disability Comparison
Paraguayans
Immigrants from Uganda
11.2%
FEMALE DISABILITY
100.0/ 100
METRIC RATING
41st/ 347
METRIC RANK
11.8%
FEMALE DISABILITY
97.2/ 100
METRIC RATING
119th/ 347
METRIC RANK
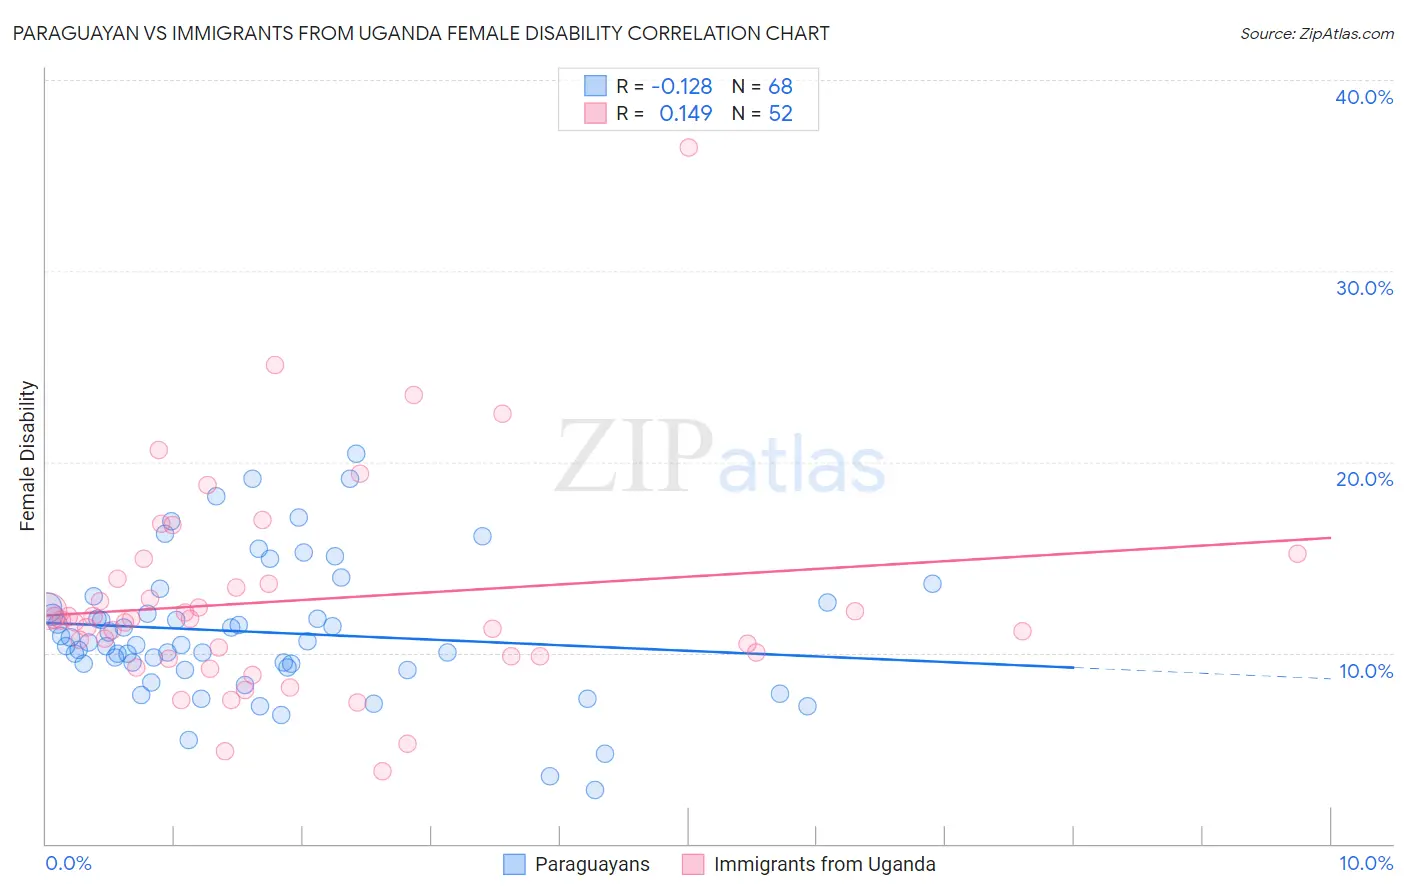
Paraguayan vs Immigrants from Uganda Female Disability Correlation Chart
The statistical analysis conducted on geographies consisting of 95,112,364 people shows a poor negative correlation between the proportion of Paraguayans and percentage of females with a disability in the United States with a correlation coefficient (R) of -0.128 and weighted average of 11.2%. Similarly, the statistical analysis conducted on geographies consisting of 125,980,314 people shows a poor positive correlation between the proportion of Immigrants from Uganda and percentage of females with a disability in the United States with a correlation coefficient (R) of 0.149 and weighted average of 11.8%, a difference of 5.0%.
Female Disability Correlation Summary
| Measurement | Paraguayan | Immigrants from Uganda |
| Minimum | 2.8% | 3.8% |
| Maximum | 20.4% | 36.5% |
| Range | 17.6% | 32.6% |
| Mean | 11.1% | 12.7% |
| Median | 10.5% | 11.8% |
| Interquartile 25% (IQ1) | 9.3% | 9.8% |
| Interquartile 75% (IQ3) | 12.5% | 13.7% |
| Interquartile Range (IQR) | 3.2% | 3.9% |
| Standard Deviation (Sample) | 3.5% | 5.5% |
| Standard Deviation (Population) | 3.5% | 5.5% |
Similar Demographics by Female Disability
Demographics Similar to Paraguayans by Female Disability
In terms of female disability, the demographic groups most similar to Paraguayans are Mongolian (11.2%, a difference of 0.020%), Immigrants from Lithuania (11.2%, a difference of 0.050%), Israeli (11.2%, a difference of 0.10%), Afghan (11.2%, a difference of 0.12%), and Immigrants from Ethiopia (11.2%, a difference of 0.26%).
| Demographics | Rating | Rank | Female Disability |
| Immigrants | Indonesia | 100.0 /100 | #34 | Exceptional 11.2% |
| Immigrants | Japan | 100.0 /100 | #35 | Exceptional 11.2% |
| Cypriots | 100.0 /100 | #36 | Exceptional 11.2% |
| Ethiopians | 100.0 /100 | #37 | Exceptional 11.2% |
| Immigrants | Ethiopia | 100.0 /100 | #38 | Exceptional 11.2% |
| Immigrants | Lithuania | 100.0 /100 | #39 | Exceptional 11.2% |
| Mongolians | 100.0 /100 | #40 | Exceptional 11.2% |
| Paraguayans | 100.0 /100 | #41 | Exceptional 11.2% |
| Israelis | 100.0 /100 | #42 | Exceptional 11.2% |
| Afghans | 100.0 /100 | #43 | Exceptional 11.2% |
| Cambodians | 100.0 /100 | #44 | Exceptional 11.3% |
| Immigrants | Sweden | 100.0 /100 | #45 | Exceptional 11.3% |
| Immigrants | Nepal | 100.0 /100 | #46 | Exceptional 11.3% |
| Jordanians | 100.0 /100 | #47 | Exceptional 11.3% |
| Zimbabweans | 100.0 /100 | #48 | Exceptional 11.3% |
Demographics Similar to Immigrants from Uganda by Female Disability
In terms of female disability, the demographic groups most similar to Immigrants from Uganda are Immigrants from Eastern Europe (11.8%, a difference of 0.010%), Immigrants from Nigeria (11.8%, a difference of 0.010%), Immigrants from Kazakhstan (11.8%, a difference of 0.080%), Immigrants from Netherlands (11.8%, a difference of 0.11%), and Immigrants from North Macedonia (11.8%, a difference of 0.12%).
| Demographics | Rating | Rank | Female Disability |
| Immigrants | Bangladesh | 97.8 /100 | #112 | Exceptional 11.8% |
| Immigrants | Belarus | 97.8 /100 | #113 | Exceptional 11.8% |
| South Africans | 97.7 /100 | #114 | Exceptional 11.8% |
| Brazilians | 97.7 /100 | #115 | Exceptional 11.8% |
| Immigrants | Morocco | 97.6 /100 | #116 | Exceptional 11.8% |
| Immigrants | Eastern Europe | 97.2 /100 | #117 | Exceptional 11.8% |
| Immigrants | Nigeria | 97.2 /100 | #118 | Exceptional 11.8% |
| Immigrants | Uganda | 97.2 /100 | #119 | Exceptional 11.8% |
| Immigrants | Kazakhstan | 97.0 /100 | #120 | Exceptional 11.8% |
| Immigrants | Netherlands | 96.9 /100 | #121 | Exceptional 11.8% |
| Immigrants | North Macedonia | 96.8 /100 | #122 | Exceptional 11.8% |
| Immigrants | Croatia | 96.7 /100 | #123 | Exceptional 11.8% |
| Russians | 96.5 /100 | #124 | Exceptional 11.8% |
| Immigrants | Italy | 96.4 /100 | #125 | Exceptional 11.8% |
| Immigrants | Europe | 96.2 /100 | #126 | Exceptional 11.8% |