Immigrants from Malaysia vs Immigrants from Uganda Female Disability
COMPARE
Immigrants from Malaysia
Immigrants from Uganda
Female Disability
Female Disability Comparison
Immigrants from Malaysia
Immigrants from Uganda
11.1%
FEMALE DISABILITY
100.0/ 100
METRIC RATING
29th/ 347
METRIC RANK
11.8%
FEMALE DISABILITY
97.2/ 100
METRIC RATING
119th/ 347
METRIC RANK
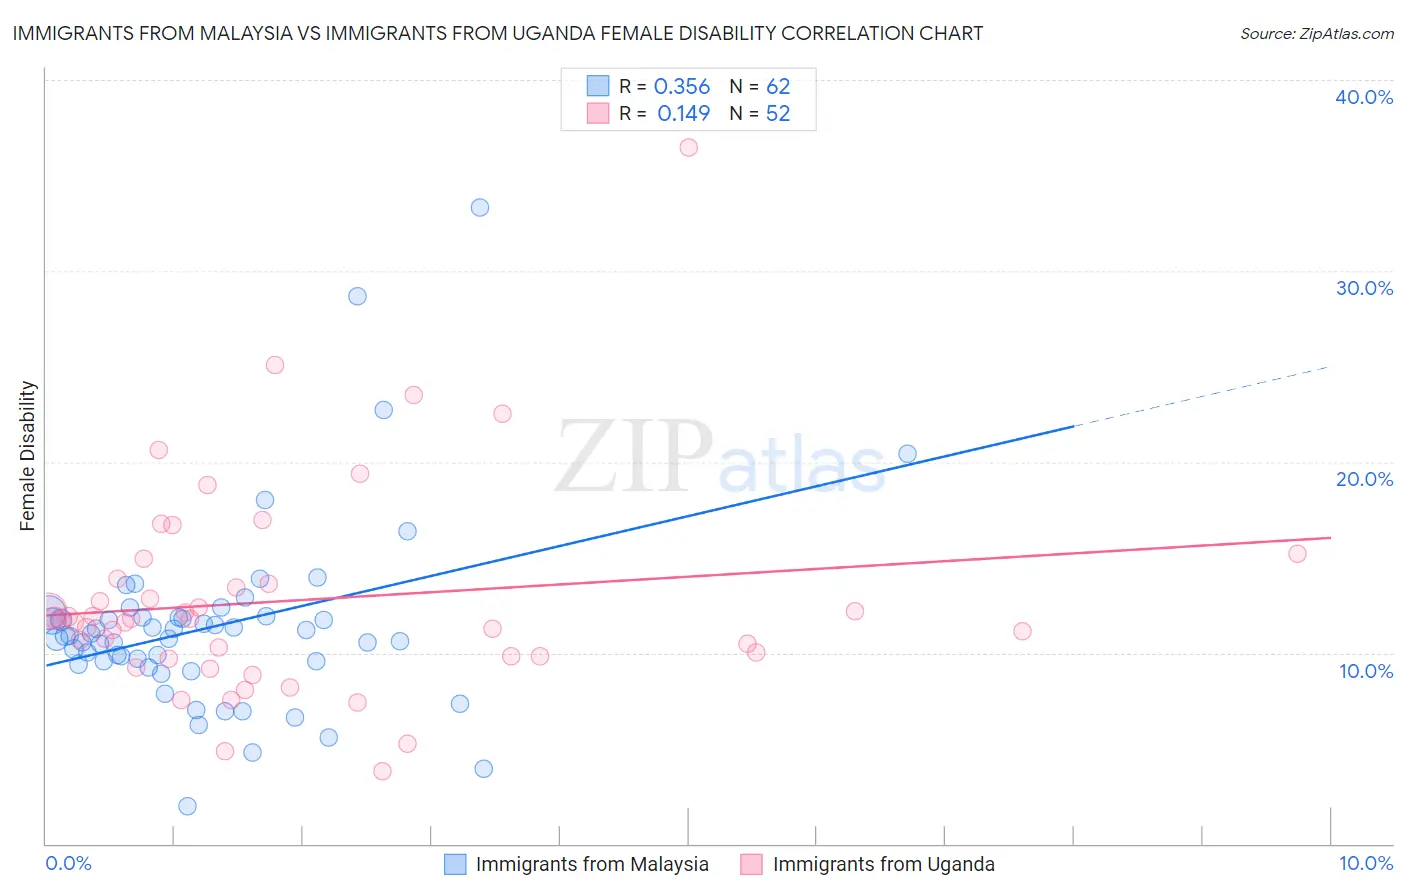
Immigrants from Malaysia vs Immigrants from Uganda Female Disability Correlation Chart
The statistical analysis conducted on geographies consisting of 197,971,207 people shows a mild positive correlation between the proportion of Immigrants from Malaysia and percentage of females with a disability in the United States with a correlation coefficient (R) of 0.356 and weighted average of 11.1%. Similarly, the statistical analysis conducted on geographies consisting of 125,980,314 people shows a poor positive correlation between the proportion of Immigrants from Uganda and percentage of females with a disability in the United States with a correlation coefficient (R) of 0.149 and weighted average of 11.8%, a difference of 6.2%.
Female Disability Correlation Summary
| Measurement | Immigrants from Malaysia | Immigrants from Uganda |
| Minimum | 1.9% | 3.8% |
| Maximum | 33.3% | 36.5% |
| Range | 31.4% | 32.6% |
| Mean | 11.4% | 12.7% |
| Median | 10.9% | 11.8% |
| Interquartile 25% (IQ1) | 9.5% | 9.8% |
| Interquartile 75% (IQ3) | 11.8% | 13.7% |
| Interquartile Range (IQR) | 2.3% | 3.9% |
| Standard Deviation (Sample) | 4.9% | 5.5% |
| Standard Deviation (Population) | 4.9% | 5.5% |
Similar Demographics by Female Disability
Demographics Similar to Immigrants from Malaysia by Female Disability
In terms of female disability, the demographic groups most similar to Immigrants from Malaysia are Turkish (11.1%, a difference of 0.0%), Egyptian (11.1%, a difference of 0.060%), Immigrants from Kuwait (11.1%, a difference of 0.10%), Immigrants from Australia (11.1%, a difference of 0.27%), and Immigrants from Turkey (11.1%, a difference of 0.34%).
| Demographics | Rating | Rank | Female Disability |
| Immigrants | Sri Lanka | 100.0 /100 | #22 | Exceptional 10.9% |
| Venezuelans | 100.0 /100 | #23 | Exceptional 11.0% |
| Immigrants | Argentina | 100.0 /100 | #24 | Exceptional 11.0% |
| Immigrants | Asia | 100.0 /100 | #25 | Exceptional 11.0% |
| Argentineans | 100.0 /100 | #26 | Exceptional 11.0% |
| Immigrants | Turkey | 100.0 /100 | #27 | Exceptional 11.1% |
| Egyptians | 100.0 /100 | #28 | Exceptional 11.1% |
| Immigrants | Malaysia | 100.0 /100 | #29 | Exceptional 11.1% |
| Turks | 100.0 /100 | #30 | Exceptional 11.1% |
| Immigrants | Kuwait | 100.0 /100 | #31 | Exceptional 11.1% |
| Immigrants | Australia | 100.0 /100 | #32 | Exceptional 11.1% |
| Immigrants | Egypt | 100.0 /100 | #33 | Exceptional 11.1% |
| Immigrants | Indonesia | 100.0 /100 | #34 | Exceptional 11.2% |
| Immigrants | Japan | 100.0 /100 | #35 | Exceptional 11.2% |
| Cypriots | 100.0 /100 | #36 | Exceptional 11.2% |
Demographics Similar to Immigrants from Uganda by Female Disability
In terms of female disability, the demographic groups most similar to Immigrants from Uganda are Immigrants from Eastern Europe (11.8%, a difference of 0.010%), Immigrants from Nigeria (11.8%, a difference of 0.010%), Immigrants from Kazakhstan (11.8%, a difference of 0.080%), Immigrants from Netherlands (11.8%, a difference of 0.11%), and Immigrants from North Macedonia (11.8%, a difference of 0.12%).
| Demographics | Rating | Rank | Female Disability |
| Immigrants | Bangladesh | 97.8 /100 | #112 | Exceptional 11.8% |
| Immigrants | Belarus | 97.8 /100 | #113 | Exceptional 11.8% |
| South Africans | 97.7 /100 | #114 | Exceptional 11.8% |
| Brazilians | 97.7 /100 | #115 | Exceptional 11.8% |
| Immigrants | Morocco | 97.6 /100 | #116 | Exceptional 11.8% |
| Immigrants | Eastern Europe | 97.2 /100 | #117 | Exceptional 11.8% |
| Immigrants | Nigeria | 97.2 /100 | #118 | Exceptional 11.8% |
| Immigrants | Uganda | 97.2 /100 | #119 | Exceptional 11.8% |
| Immigrants | Kazakhstan | 97.0 /100 | #120 | Exceptional 11.8% |
| Immigrants | Netherlands | 96.9 /100 | #121 | Exceptional 11.8% |
| Immigrants | North Macedonia | 96.8 /100 | #122 | Exceptional 11.8% |
| Immigrants | Croatia | 96.7 /100 | #123 | Exceptional 11.8% |
| Russians | 96.5 /100 | #124 | Exceptional 11.8% |
| Immigrants | Italy | 96.4 /100 | #125 | Exceptional 11.8% |
| Immigrants | Europe | 96.2 /100 | #126 | Exceptional 11.8% |