Ottawa vs Spaniard Vision Disability
COMPARE
Ottawa
Spaniard
Vision Disability
Vision Disability Comparison
Ottawa
Spaniards
2.5%
VISION DISABILITY
0.0/ 100
METRIC RATING
294th/ 347
METRIC RANK
2.4%
VISION DISABILITY
0.1/ 100
METRIC RATING
272nd/ 347
METRIC RANK
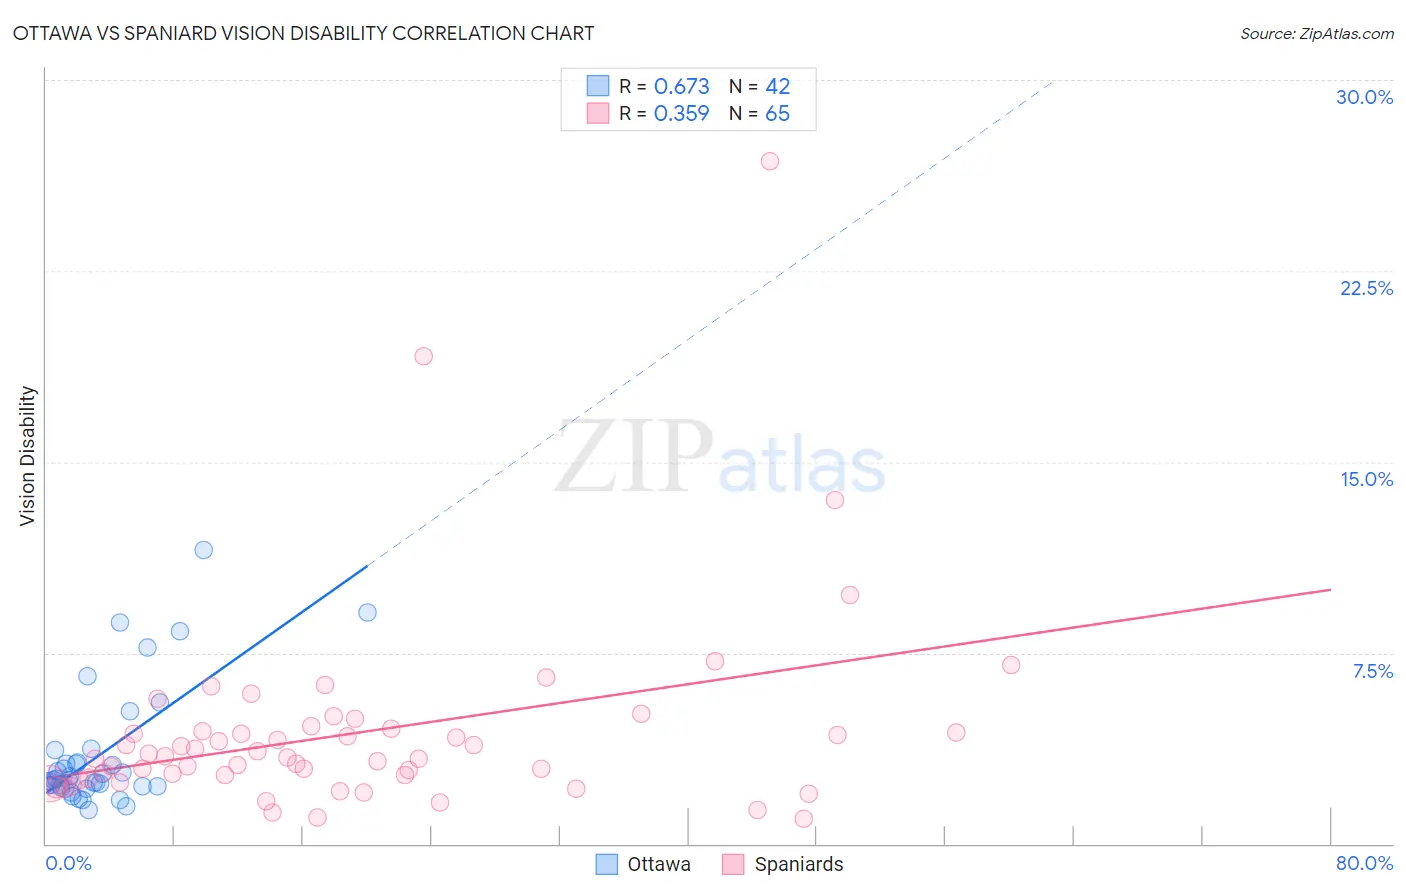
Ottawa vs Spaniard Vision Disability Correlation Chart
The statistical analysis conducted on geographies consisting of 49,950,834 people shows a significant positive correlation between the proportion of Ottawa and percentage of population with vision disability in the United States with a correlation coefficient (R) of 0.673 and weighted average of 2.5%. Similarly, the statistical analysis conducted on geographies consisting of 443,022,982 people shows a mild positive correlation between the proportion of Spaniards and percentage of population with vision disability in the United States with a correlation coefficient (R) of 0.359 and weighted average of 2.4%, a difference of 3.7%.
Vision Disability Correlation Summary
| Measurement | Ottawa | Spaniard |
| Minimum | 1.3% | 0.97% |
| Maximum | 11.5% | 26.8% |
| Range | 10.2% | 25.9% |
| Mean | 3.5% | 4.4% |
| Median | 2.5% | 3.4% |
| Interquartile 25% (IQ1) | 2.2% | 2.5% |
| Interquartile 75% (IQ3) | 3.2% | 4.4% |
| Interquartile Range (IQR) | 0.96% | 1.9% |
| Standard Deviation (Sample) | 2.4% | 4.0% |
| Standard Deviation (Population) | 2.3% | 3.9% |
Similar Demographics by Vision Disability
Demographics Similar to Ottawa by Vision Disability
In terms of vision disability, the demographic groups most similar to Ottawa are Delaware (2.5%, a difference of 0.21%), Immigrants from Mexico (2.5%, a difference of 0.32%), Yaqui (2.5%, a difference of 0.34%), Crow (2.5%, a difference of 0.36%), and Immigrants from Honduras (2.5%, a difference of 0.46%).
| Demographics | Rating | Rank | Vision Disability |
| Hondurans | 0.0 /100 | #287 | Tragic 2.5% |
| French American Indians | 0.0 /100 | #288 | Tragic 2.5% |
| Immigrants | Nonimmigrants | 0.0 /100 | #289 | Tragic 2.5% |
| Immigrants | Cuba | 0.0 /100 | #290 | Tragic 2.5% |
| Immigrants | Honduras | 0.0 /100 | #291 | Tragic 2.5% |
| Crow | 0.0 /100 | #292 | Tragic 2.5% |
| Yaqui | 0.0 /100 | #293 | Tragic 2.5% |
| Ottawa | 0.0 /100 | #294 | Tragic 2.5% |
| Delaware | 0.0 /100 | #295 | Tragic 2.5% |
| Immigrants | Mexico | 0.0 /100 | #296 | Tragic 2.5% |
| Immigrants | Dominica | 0.0 /100 | #297 | Tragic 2.5% |
| Mexicans | 0.0 /100 | #298 | Tragic 2.5% |
| Cree | 0.0 /100 | #299 | Tragic 2.5% |
| Africans | 0.0 /100 | #300 | Tragic 2.5% |
| Menominee | 0.0 /100 | #301 | Tragic 2.5% |
Demographics Similar to Spaniards by Vision Disability
In terms of vision disability, the demographic groups most similar to Spaniards are Immigrants from the Azores (2.4%, a difference of 0.10%), Cuban (2.4%, a difference of 0.26%), Celtic (2.4%, a difference of 0.27%), Immigrants from Bahamas (2.4%, a difference of 0.33%), and Senegalese (2.4%, a difference of 0.54%).
| Demographics | Rating | Rank | Vision Disability |
| Immigrants | Jamaica | 0.1 /100 | #265 | Tragic 2.4% |
| Mexican American Indians | 0.1 /100 | #266 | Tragic 2.4% |
| Ute | 0.1 /100 | #267 | Tragic 2.4% |
| Senegalese | 0.1 /100 | #268 | Tragic 2.4% |
| Celtics | 0.1 /100 | #269 | Tragic 2.4% |
| Cubans | 0.1 /100 | #270 | Tragic 2.4% |
| Immigrants | Azores | 0.1 /100 | #271 | Tragic 2.4% |
| Spaniards | 0.1 /100 | #272 | Tragic 2.4% |
| Immigrants | Bahamas | 0.1 /100 | #273 | Tragic 2.4% |
| Immigrants | Latin America | 0.0 /100 | #274 | Tragic 2.4% |
| Chippewa | 0.0 /100 | #275 | Tragic 2.4% |
| Scotch-Irish | 0.0 /100 | #276 | Tragic 2.4% |
| Bahamians | 0.0 /100 | #277 | Tragic 2.4% |
| Spanish | 0.0 /100 | #278 | Tragic 2.4% |
| Nepalese | 0.0 /100 | #279 | Tragic 2.4% |