Okinawan vs West Indian Male Disability
COMPARE
Okinawan
West Indian
Male Disability
Male Disability Comparison
Okinawans
West Indians
9.8%
MALE DISABILITY
100.0/ 100
METRIC RATING
16th/ 347
METRIC RANK
11.4%
MALE DISABILITY
18.4/ 100
METRIC RATING
196th/ 347
METRIC RANK
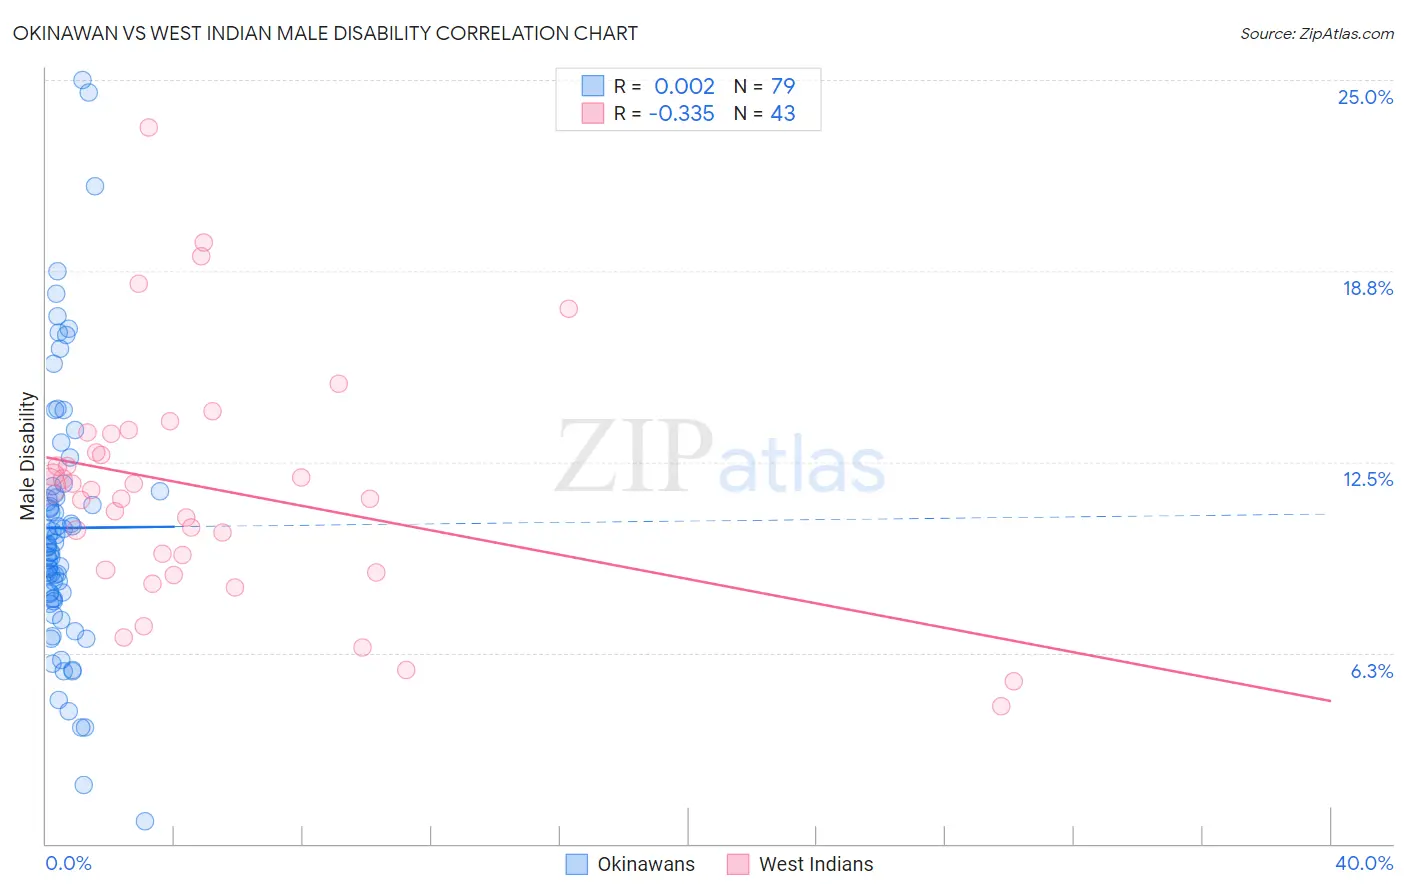
Okinawan vs West Indian Male Disability Correlation Chart
The statistical analysis conducted on geographies consisting of 73,770,513 people shows no correlation between the proportion of Okinawans and percentage of males with a disability in the United States with a correlation coefficient (R) of 0.002 and weighted average of 9.8%. Similarly, the statistical analysis conducted on geographies consisting of 254,013,623 people shows a mild negative correlation between the proportion of West Indians and percentage of males with a disability in the United States with a correlation coefficient (R) of -0.335 and weighted average of 11.4%, a difference of 17.1%.
Male Disability Correlation Summary
| Measurement | Okinawan | West Indian |
| Minimum | 0.75% | 4.5% |
| Maximum | 25.0% | 23.5% |
| Range | 24.2% | 19.0% |
| Mean | 10.3% | 11.6% |
| Median | 9.7% | 11.6% |
| Interquartile 25% (IQ1) | 8.0% | 8.9% |
| Interquartile 75% (IQ3) | 11.5% | 13.4% |
| Interquartile Range (IQR) | 3.5% | 4.5% |
| Standard Deviation (Sample) | 4.4% | 3.9% |
| Standard Deviation (Population) | 4.4% | 3.8% |
Similar Demographics by Male Disability
Demographics Similar to Okinawans by Male Disability
In terms of male disability, the demographic groups most similar to Okinawans are Immigrants from Korea (9.8%, a difference of 0.14%), Indian (Asian) (9.7%, a difference of 0.61%), Immigrants from Pakistan (9.8%, a difference of 0.70%), Immigrants from Iran (9.7%, a difference of 1.1%), and Iranian (9.7%, a difference of 1.2%).
| Demographics | Rating | Rank | Male Disability |
| Immigrants | Singapore | 100.0 /100 | #9 | Exceptional 9.5% |
| Immigrants | Israel | 100.0 /100 | #10 | Exceptional 9.6% |
| Immigrants | Eastern Asia | 100.0 /100 | #11 | Exceptional 9.6% |
| Bolivians | 100.0 /100 | #12 | Exceptional 9.6% |
| Iranians | 100.0 /100 | #13 | Exceptional 9.7% |
| Immigrants | Iran | 100.0 /100 | #14 | Exceptional 9.7% |
| Indians (Asian) | 100.0 /100 | #15 | Exceptional 9.7% |
| Okinawans | 100.0 /100 | #16 | Exceptional 9.8% |
| Immigrants | Korea | 100.0 /100 | #17 | Exceptional 9.8% |
| Immigrants | Pakistan | 100.0 /100 | #18 | Exceptional 9.8% |
| Immigrants | Sri Lanka | 100.0 /100 | #19 | Exceptional 10.0% |
| Asians | 100.0 /100 | #20 | Exceptional 10.0% |
| Burmese | 100.0 /100 | #21 | Exceptional 10.0% |
| Immigrants | Venezuela | 100.0 /100 | #22 | Exceptional 10.0% |
| Cypriots | 100.0 /100 | #23 | Exceptional 10.0% |
Demographics Similar to West Indians by Male Disability
In terms of male disability, the demographic groups most similar to West Indians are Somali (11.4%, a difference of 0.020%), Immigrants from Jamaica (11.5%, a difference of 0.20%), Immigrants from Oceania (11.4%, a difference of 0.22%), Belizean (11.4%, a difference of 0.24%), and Lebanese (11.5%, a difference of 0.29%).
| Demographics | Rating | Rank | Male Disability |
| Immigrants | Netherlands | 25.9 /100 | #189 | Fair 11.4% |
| Immigrants | Bosnia and Herzegovina | 25.4 /100 | #190 | Fair 11.4% |
| Senegalese | 23.2 /100 | #191 | Fair 11.4% |
| Assyrians/Chaldeans/Syriacs | 23.2 /100 | #192 | Fair 11.4% |
| Greeks | 22.2 /100 | #193 | Fair 11.4% |
| Belizeans | 21.2 /100 | #194 | Fair 11.4% |
| Immigrants | Oceania | 20.9 /100 | #195 | Fair 11.4% |
| West Indians | 18.4 /100 | #196 | Poor 11.4% |
| Somalis | 18.2 /100 | #197 | Poor 11.4% |
| Immigrants | Jamaica | 16.3 /100 | #198 | Poor 11.5% |
| Lebanese | 15.4 /100 | #199 | Poor 11.5% |
| Immigrants | Iraq | 13.0 /100 | #200 | Poor 11.5% |
| Immigrants | Panama | 13.0 /100 | #201 | Poor 11.5% |
| Immigrants | Mexico | 12.6 /100 | #202 | Poor 11.5% |
| Jamaicans | 10.9 /100 | #203 | Poor 11.5% |