Cuban vs West Indian Male Disability
COMPARE
Cuban
West Indian
Male Disability
Male Disability Comparison
Cubans
West Indians
11.0%
MALE DISABILITY
74.9/ 100
METRIC RATING
151st/ 347
METRIC RANK
11.4%
MALE DISABILITY
18.4/ 100
METRIC RATING
196th/ 347
METRIC RANK
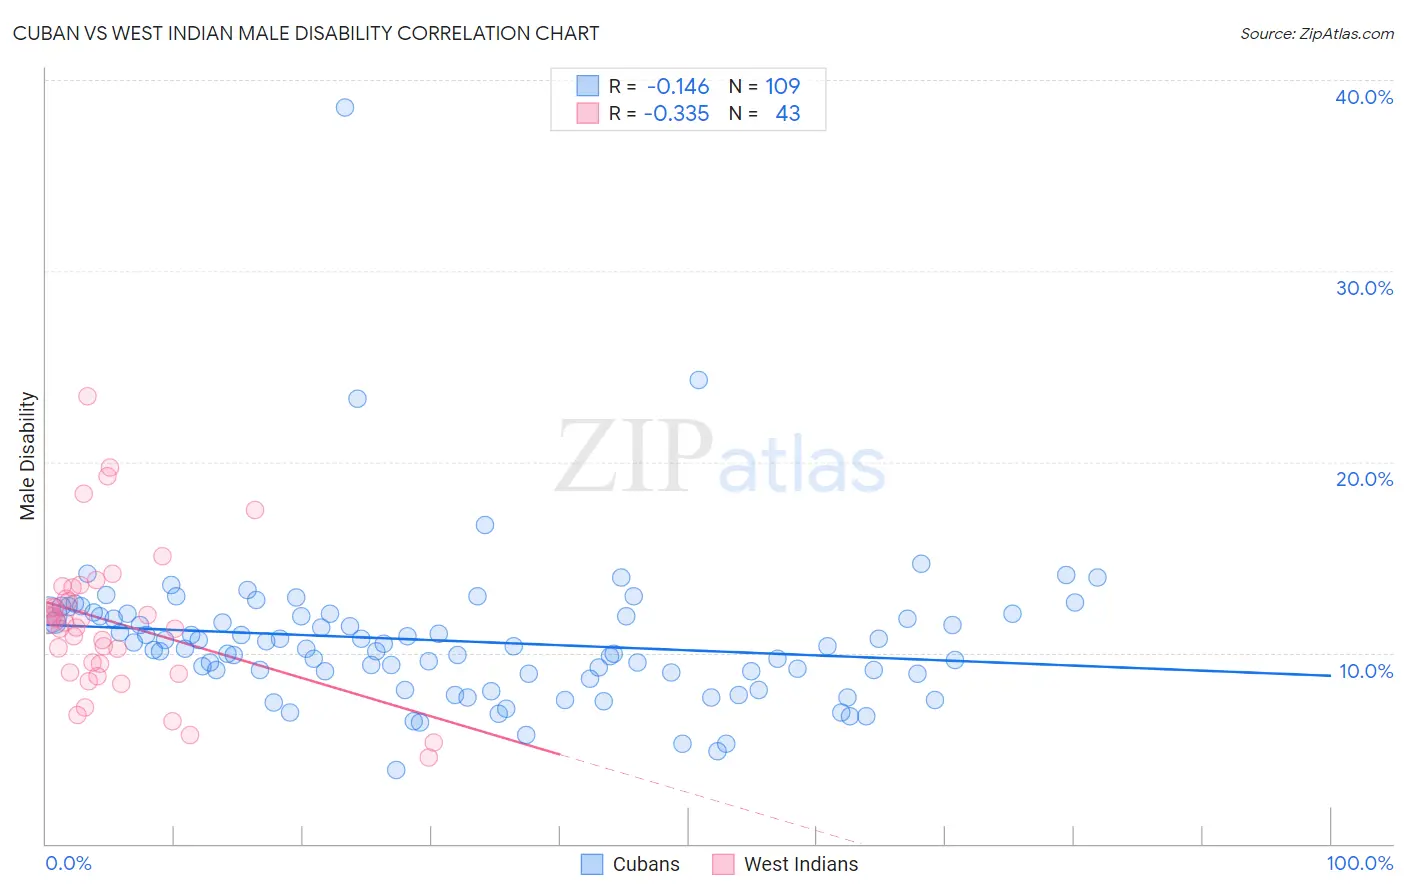
Cuban vs West Indian Male Disability Correlation Chart
The statistical analysis conducted on geographies consisting of 449,227,297 people shows a poor negative correlation between the proportion of Cubans and percentage of males with a disability in the United States with a correlation coefficient (R) of -0.146 and weighted average of 11.0%. Similarly, the statistical analysis conducted on geographies consisting of 254,013,623 people shows a mild negative correlation between the proportion of West Indians and percentage of males with a disability in the United States with a correlation coefficient (R) of -0.335 and weighted average of 11.4%, a difference of 3.6%.
Male Disability Correlation Summary
| Measurement | Cuban | West Indian |
| Minimum | 3.9% | 4.5% |
| Maximum | 38.6% | 23.5% |
| Range | 34.7% | 19.0% |
| Mean | 10.6% | 11.6% |
| Median | 10.2% | 11.6% |
| Interquartile 25% (IQ1) | 8.9% | 8.9% |
| Interquartile 75% (IQ3) | 11.9% | 13.4% |
| Interquartile Range (IQR) | 3.0% | 4.5% |
| Standard Deviation (Sample) | 4.0% | 3.9% |
| Standard Deviation (Population) | 4.0% | 3.8% |
Similar Demographics by Male Disability
Demographics Similar to Cubans by Male Disability
In terms of male disability, the demographic groups most similar to Cubans are Immigrants from Guatemala (11.0%, a difference of 0.020%), Immigrants from Albania (11.0%, a difference of 0.030%), Immigrants from Denmark (11.0%, a difference of 0.12%), Immigrants from Northern Europe (11.1%, a difference of 0.12%), and Immigrants from Moldova (11.1%, a difference of 0.15%).
| Demographics | Rating | Rank | Male Disability |
| Kenyans | 78.1 /100 | #144 | Good 11.0% |
| Costa Ricans | 78.0 /100 | #145 | Good 11.0% |
| Koreans | 77.5 /100 | #146 | Good 11.0% |
| Immigrants | Croatia | 77.3 /100 | #147 | Good 11.0% |
| Sudanese | 77.1 /100 | #148 | Good 11.0% |
| Immigrants | Denmark | 76.4 /100 | #149 | Good 11.0% |
| Immigrants | Guatemala | 75.1 /100 | #150 | Good 11.0% |
| Cubans | 74.9 /100 | #151 | Good 11.0% |
| Immigrants | Albania | 74.4 /100 | #152 | Good 11.0% |
| Immigrants | Northern Europe | 73.2 /100 | #153 | Good 11.1% |
| Immigrants | Moldova | 72.8 /100 | #154 | Good 11.1% |
| Immigrants | Middle Africa | 70.9 /100 | #155 | Good 11.1% |
| Russians | 69.8 /100 | #156 | Good 11.1% |
| Immigrants | Western Africa | 69.2 /100 | #157 | Good 11.1% |
| Latvians | 68.1 /100 | #158 | Good 11.1% |
Demographics Similar to West Indians by Male Disability
In terms of male disability, the demographic groups most similar to West Indians are Somali (11.4%, a difference of 0.020%), Immigrants from Jamaica (11.5%, a difference of 0.20%), Immigrants from Oceania (11.4%, a difference of 0.22%), Belizean (11.4%, a difference of 0.24%), and Lebanese (11.5%, a difference of 0.29%).
| Demographics | Rating | Rank | Male Disability |
| Immigrants | Netherlands | 25.9 /100 | #189 | Fair 11.4% |
| Immigrants | Bosnia and Herzegovina | 25.4 /100 | #190 | Fair 11.4% |
| Senegalese | 23.2 /100 | #191 | Fair 11.4% |
| Assyrians/Chaldeans/Syriacs | 23.2 /100 | #192 | Fair 11.4% |
| Greeks | 22.2 /100 | #193 | Fair 11.4% |
| Belizeans | 21.2 /100 | #194 | Fair 11.4% |
| Immigrants | Oceania | 20.9 /100 | #195 | Fair 11.4% |
| West Indians | 18.4 /100 | #196 | Poor 11.4% |
| Somalis | 18.2 /100 | #197 | Poor 11.4% |
| Immigrants | Jamaica | 16.3 /100 | #198 | Poor 11.5% |
| Lebanese | 15.4 /100 | #199 | Poor 11.5% |
| Immigrants | Iraq | 13.0 /100 | #200 | Poor 11.5% |
| Immigrants | Panama | 13.0 /100 | #201 | Poor 11.5% |
| Immigrants | Mexico | 12.6 /100 | #202 | Poor 11.5% |
| Jamaicans | 10.9 /100 | #203 | Poor 11.5% |