Okinawan vs Immigrants from Armenia Male Disability
COMPARE
Okinawan
Immigrants from Armenia
Male Disability
Male Disability Comparison
Okinawans
Immigrants from Armenia
9.8%
MALE DISABILITY
100.0/ 100
METRIC RATING
16th/ 347
METRIC RANK
10.7%
MALE DISABILITY
96.6/ 100
METRIC RATING
97th/ 347
METRIC RANK
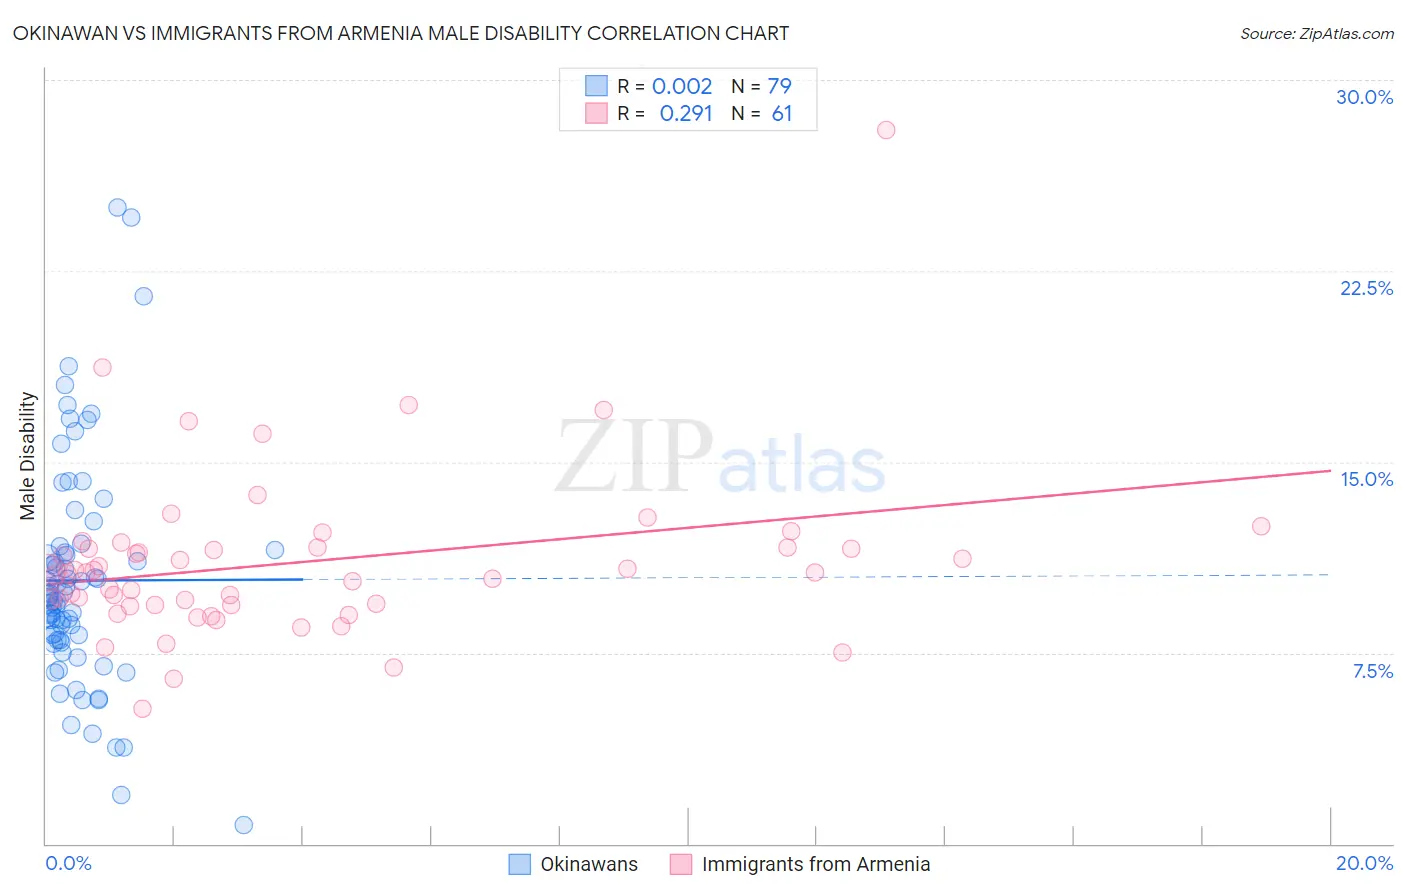
Okinawan vs Immigrants from Armenia Male Disability Correlation Chart
The statistical analysis conducted on geographies consisting of 73,770,513 people shows no correlation between the proportion of Okinawans and percentage of males with a disability in the United States with a correlation coefficient (R) of 0.002 and weighted average of 9.8%. Similarly, the statistical analysis conducted on geographies consisting of 97,710,322 people shows a weak positive correlation between the proportion of Immigrants from Armenia and percentage of males with a disability in the United States with a correlation coefficient (R) of 0.291 and weighted average of 10.7%, a difference of 9.4%.
Male Disability Correlation Summary
| Measurement | Okinawan | Immigrants from Armenia |
| Minimum | 0.75% | 5.3% |
| Maximum | 25.0% | 28.0% |
| Range | 24.2% | 22.8% |
| Mean | 10.3% | 11.1% |
| Median | 9.7% | 10.6% |
| Interquartile 25% (IQ1) | 8.0% | 9.4% |
| Interquartile 75% (IQ3) | 11.5% | 11.6% |
| Interquartile Range (IQR) | 3.5% | 2.3% |
| Standard Deviation (Sample) | 4.4% | 3.3% |
| Standard Deviation (Population) | 4.4% | 3.3% |
Similar Demographics by Male Disability
Demographics Similar to Okinawans by Male Disability
In terms of male disability, the demographic groups most similar to Okinawans are Immigrants from Korea (9.8%, a difference of 0.14%), Indian (Asian) (9.7%, a difference of 0.61%), Immigrants from Pakistan (9.8%, a difference of 0.70%), Immigrants from Iran (9.7%, a difference of 1.1%), and Iranian (9.7%, a difference of 1.2%).
| Demographics | Rating | Rank | Male Disability |
| Immigrants | Singapore | 100.0 /100 | #9 | Exceptional 9.5% |
| Immigrants | Israel | 100.0 /100 | #10 | Exceptional 9.6% |
| Immigrants | Eastern Asia | 100.0 /100 | #11 | Exceptional 9.6% |
| Bolivians | 100.0 /100 | #12 | Exceptional 9.6% |
| Iranians | 100.0 /100 | #13 | Exceptional 9.7% |
| Immigrants | Iran | 100.0 /100 | #14 | Exceptional 9.7% |
| Indians (Asian) | 100.0 /100 | #15 | Exceptional 9.7% |
| Okinawans | 100.0 /100 | #16 | Exceptional 9.8% |
| Immigrants | Korea | 100.0 /100 | #17 | Exceptional 9.8% |
| Immigrants | Pakistan | 100.0 /100 | #18 | Exceptional 9.8% |
| Immigrants | Sri Lanka | 100.0 /100 | #19 | Exceptional 10.0% |
| Asians | 100.0 /100 | #20 | Exceptional 10.0% |
| Burmese | 100.0 /100 | #21 | Exceptional 10.0% |
| Immigrants | Venezuela | 100.0 /100 | #22 | Exceptional 10.0% |
| Cypriots | 100.0 /100 | #23 | Exceptional 10.0% |
Demographics Similar to Immigrants from Armenia by Male Disability
In terms of male disability, the demographic groups most similar to Immigrants from Armenia are Nicaraguan (10.7%, a difference of 0.020%), Immigrants from Romania (10.7%, a difference of 0.060%), Chilean (10.7%, a difference of 0.12%), Immigrants from Sweden (10.7%, a difference of 0.15%), and Immigrants from Switzerland (10.7%, a difference of 0.20%).
| Demographics | Rating | Rank | Male Disability |
| Immigrants | Morocco | 97.7 /100 | #90 | Exceptional 10.6% |
| Immigrants | France | 97.6 /100 | #91 | Exceptional 10.6% |
| Palestinians | 97.4 /100 | #92 | Exceptional 10.7% |
| Immigrants | St. Vincent and the Grenadines | 97.1 /100 | #93 | Exceptional 10.7% |
| Immigrants | Sweden | 96.9 /100 | #94 | Exceptional 10.7% |
| Chileans | 96.9 /100 | #95 | Exceptional 10.7% |
| Nicaraguans | 96.6 /100 | #96 | Exceptional 10.7% |
| Immigrants | Armenia | 96.6 /100 | #97 | Exceptional 10.7% |
| Immigrants | Romania | 96.5 /100 | #98 | Exceptional 10.7% |
| Immigrants | Switzerland | 96.1 /100 | #99 | Exceptional 10.7% |
| Immigrants | Kazakhstan | 95.9 /100 | #100 | Exceptional 10.7% |
| Immigrants | Greece | 95.6 /100 | #101 | Exceptional 10.7% |
| Immigrants | Eastern Europe | 95.3 /100 | #102 | Exceptional 10.7% |
| Uruguayans | 95.3 /100 | #103 | Exceptional 10.7% |
| Immigrants | Nigeria | 95.1 /100 | #104 | Exceptional 10.8% |