Okinawan vs Argentinean Male Disability
COMPARE
Okinawan
Argentinean
Male Disability
Male Disability Comparison
Okinawans
Argentineans
9.8%
MALE DISABILITY
100.0/ 100
METRIC RATING
16th/ 347
METRIC RANK
10.1%
MALE DISABILITY
99.9/ 100
METRIC RATING
32nd/ 347
METRIC RANK
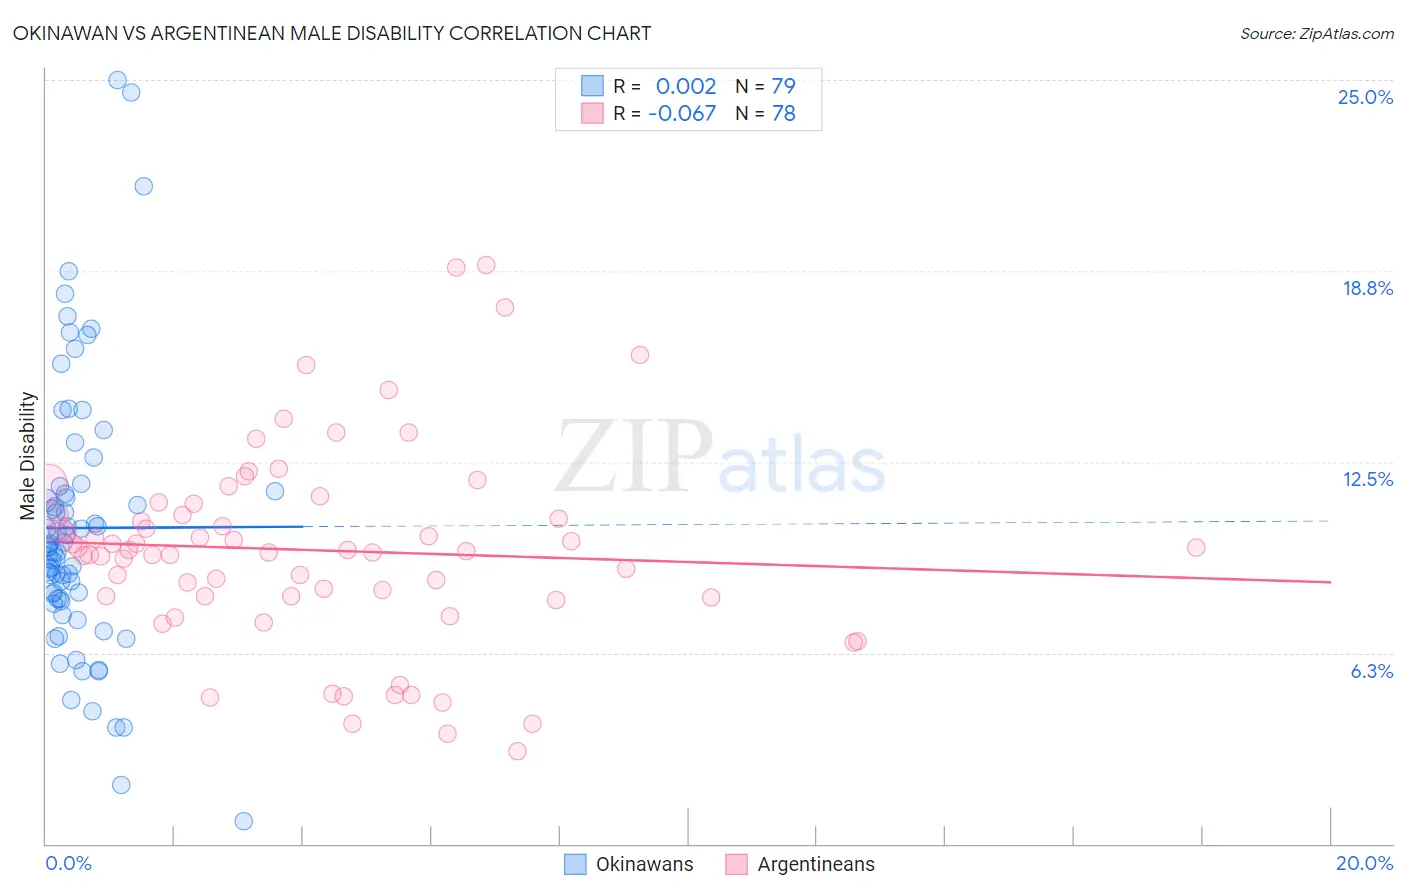
Okinawan vs Argentinean Male Disability Correlation Chart
The statistical analysis conducted on geographies consisting of 73,770,513 people shows no correlation between the proportion of Okinawans and percentage of males with a disability in the United States with a correlation coefficient (R) of 0.002 and weighted average of 9.8%. Similarly, the statistical analysis conducted on geographies consisting of 297,137,654 people shows a slight negative correlation between the proportion of Argentineans and percentage of males with a disability in the United States with a correlation coefficient (R) of -0.067 and weighted average of 10.1%, a difference of 3.7%.
Male Disability Correlation Summary
| Measurement | Okinawan | Argentinean |
| Minimum | 0.75% | 3.0% |
| Maximum | 25.0% | 18.9% |
| Range | 24.2% | 15.9% |
| Mean | 10.3% | 9.6% |
| Median | 9.7% | 9.6% |
| Interquartile 25% (IQ1) | 8.0% | 8.1% |
| Interquartile 75% (IQ3) | 11.5% | 10.8% |
| Interquartile Range (IQR) | 3.5% | 2.7% |
| Standard Deviation (Sample) | 4.4% | 3.2% |
| Standard Deviation (Population) | 4.4% | 3.2% |
Demographics Similar to Okinawans and Argentineans by Male Disability
In terms of male disability, the demographic groups most similar to Okinawans are Immigrants from Korea (9.8%, a difference of 0.14%), Indian (Asian) (9.7%, a difference of 0.61%), Immigrants from Pakistan (9.8%, a difference of 0.70%), Immigrants from Iran (9.7%, a difference of 1.1%), and Immigrants from Sri Lanka (10.0%, a difference of 1.9%). Similarly, the demographic groups most similar to Argentineans are Soviet Union (10.1%, a difference of 0.15%), Immigrants from Egypt (10.1%, a difference of 0.22%), Venezuelan (10.1%, a difference of 0.25%), Vietnamese (10.1%, a difference of 0.41%), and Egyptian (10.1%, a difference of 0.43%).
| Demographics | Rating | Rank | Male Disability |
| Immigrants | Iran | 100.0 /100 | #14 | Exceptional 9.7% |
| Indians (Asian) | 100.0 /100 | #15 | Exceptional 9.7% |
| Okinawans | 100.0 /100 | #16 | Exceptional 9.8% |
| Immigrants | Korea | 100.0 /100 | #17 | Exceptional 9.8% |
| Immigrants | Pakistan | 100.0 /100 | #18 | Exceptional 9.8% |
| Immigrants | Sri Lanka | 100.0 /100 | #19 | Exceptional 10.0% |
| Asians | 100.0 /100 | #20 | Exceptional 10.0% |
| Burmese | 100.0 /100 | #21 | Exceptional 10.0% |
| Immigrants | Venezuela | 100.0 /100 | #22 | Exceptional 10.0% |
| Cypriots | 100.0 /100 | #23 | Exceptional 10.0% |
| Immigrants | Asia | 100.0 /100 | #24 | Exceptional 10.0% |
| Immigrants | Malaysia | 99.9 /100 | #25 | Exceptional 10.0% |
| Paraguayans | 99.9 /100 | #26 | Exceptional 10.1% |
| Egyptians | 99.9 /100 | #27 | Exceptional 10.1% |
| Vietnamese | 99.9 /100 | #28 | Exceptional 10.1% |
| Venezuelans | 99.9 /100 | #29 | Exceptional 10.1% |
| Immigrants | Egypt | 99.9 /100 | #30 | Exceptional 10.1% |
| Soviet Union | 99.9 /100 | #31 | Exceptional 10.1% |
| Argentineans | 99.9 /100 | #32 | Exceptional 10.1% |
| Immigrants | Ethiopia | 99.9 /100 | #33 | Exceptional 10.2% |
| Immigrants | Turkey | 99.9 /100 | #34 | Exceptional 10.2% |