Immigrants from Uganda vs West Indian Male Disability
COMPARE
Immigrants from Uganda
West Indian
Male Disability
Male Disability Comparison
Immigrants from Uganda
West Indians
10.8%
MALE DISABILITY
94.0/ 100
METRIC RATING
109th/ 347
METRIC RANK
11.4%
MALE DISABILITY
18.4/ 100
METRIC RATING
196th/ 347
METRIC RANK
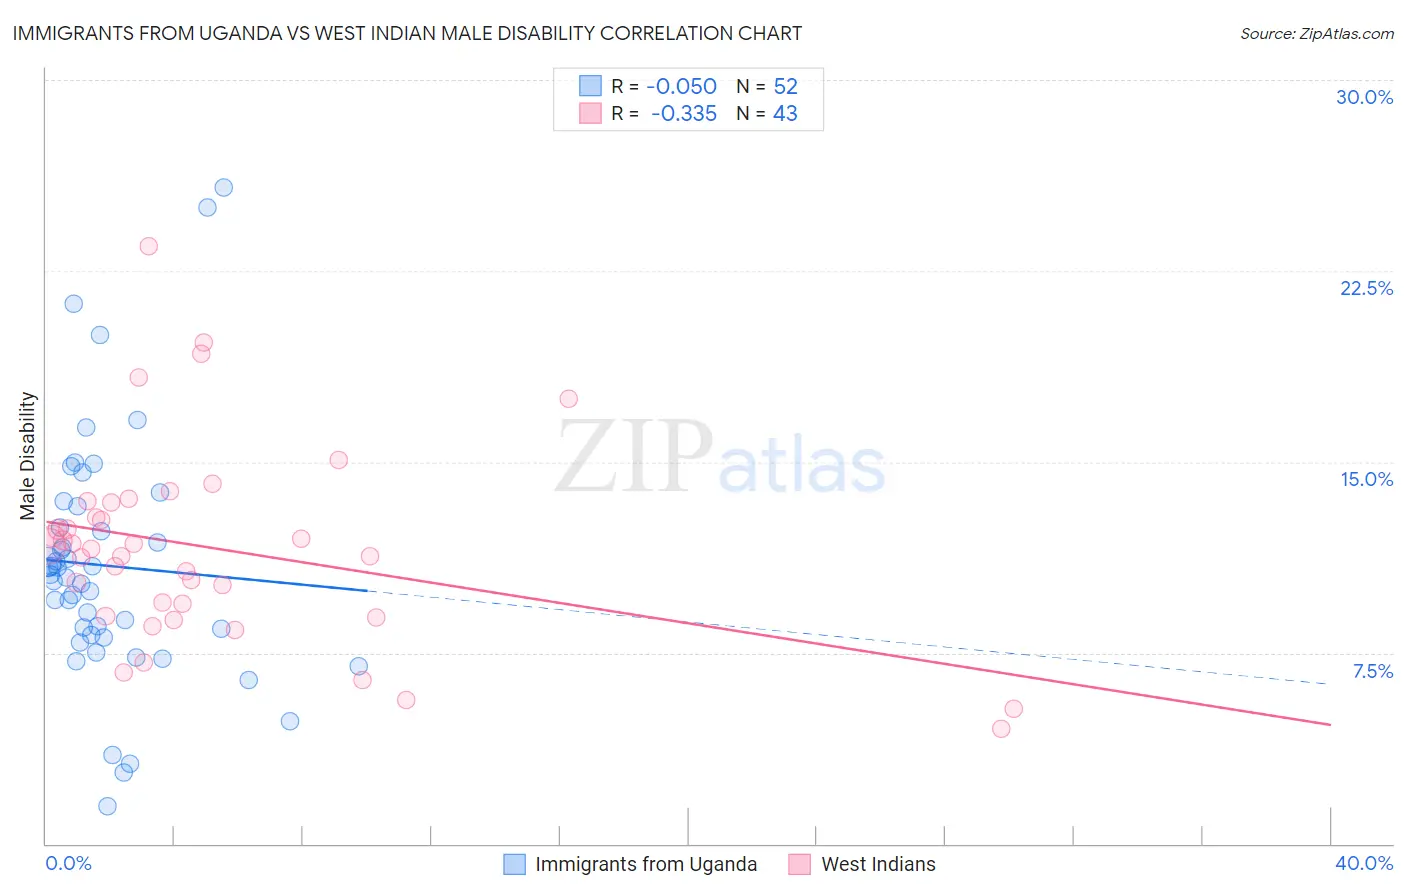
Immigrants from Uganda vs West Indian Male Disability Correlation Chart
The statistical analysis conducted on geographies consisting of 125,978,860 people shows a slight negative correlation between the proportion of Immigrants from Uganda and percentage of males with a disability in the United States with a correlation coefficient (R) of -0.050 and weighted average of 10.8%. Similarly, the statistical analysis conducted on geographies consisting of 254,013,623 people shows a mild negative correlation between the proportion of West Indians and percentage of males with a disability in the United States with a correlation coefficient (R) of -0.335 and weighted average of 11.4%, a difference of 6.1%.
Male Disability Correlation Summary
| Measurement | Immigrants from Uganda | West Indian |
| Minimum | 1.5% | 4.5% |
| Maximum | 25.8% | 23.5% |
| Range | 24.3% | 19.0% |
| Mean | 10.9% | 11.6% |
| Median | 10.5% | 11.6% |
| Interquartile 25% (IQ1) | 8.2% | 8.9% |
| Interquartile 75% (IQ3) | 12.8% | 13.4% |
| Interquartile Range (IQR) | 4.7% | 4.5% |
| Standard Deviation (Sample) | 4.9% | 3.9% |
| Standard Deviation (Population) | 4.8% | 3.8% |
Similar Demographics by Male Disability
Demographics Similar to Immigrants from Uganda by Male Disability
In terms of male disability, the demographic groups most similar to Immigrants from Uganda are Immigrants (10.8%, a difference of 0.030%), Immigrants from Belgium (10.8%, a difference of 0.050%), Immigrants from Uruguay (10.8%, a difference of 0.060%), Immigrants from Eastern Africa (10.8%, a difference of 0.070%), and Ghanaian (10.8%, a difference of 0.16%).
| Demographics | Rating | Rank | Male Disability |
| Immigrants | Eastern Europe | 95.3 /100 | #102 | Exceptional 10.7% |
| Uruguayans | 95.3 /100 | #103 | Exceptional 10.7% |
| Immigrants | Nigeria | 95.1 /100 | #104 | Exceptional 10.8% |
| Immigrants | Brazil | 95.0 /100 | #105 | Exceptional 10.8% |
| Immigrants | Syria | 94.9 /100 | #106 | Exceptional 10.8% |
| Immigrants | Eastern Africa | 94.3 /100 | #107 | Exceptional 10.8% |
| Immigrants | Belgium | 94.2 /100 | #108 | Exceptional 10.8% |
| Immigrants | Uganda | 94.0 /100 | #109 | Exceptional 10.8% |
| Immigrants | Immigrants | 93.9 /100 | #110 | Exceptional 10.8% |
| Immigrants | Uruguay | 93.8 /100 | #111 | Exceptional 10.8% |
| Ghanaians | 93.4 /100 | #112 | Exceptional 10.8% |
| Immigrants | Zimbabwe | 93.0 /100 | #113 | Exceptional 10.8% |
| Central Americans | 92.7 /100 | #114 | Exceptional 10.8% |
| Immigrants | Barbados | 92.2 /100 | #115 | Exceptional 10.8% |
| Immigrants | South Africa | 91.8 /100 | #116 | Exceptional 10.8% |
Demographics Similar to West Indians by Male Disability
In terms of male disability, the demographic groups most similar to West Indians are Somali (11.4%, a difference of 0.020%), Immigrants from Jamaica (11.5%, a difference of 0.20%), Immigrants from Oceania (11.4%, a difference of 0.22%), Belizean (11.4%, a difference of 0.24%), and Lebanese (11.5%, a difference of 0.29%).
| Demographics | Rating | Rank | Male Disability |
| Immigrants | Netherlands | 25.9 /100 | #189 | Fair 11.4% |
| Immigrants | Bosnia and Herzegovina | 25.4 /100 | #190 | Fair 11.4% |
| Senegalese | 23.2 /100 | #191 | Fair 11.4% |
| Assyrians/Chaldeans/Syriacs | 23.2 /100 | #192 | Fair 11.4% |
| Greeks | 22.2 /100 | #193 | Fair 11.4% |
| Belizeans | 21.2 /100 | #194 | Fair 11.4% |
| Immigrants | Oceania | 20.9 /100 | #195 | Fair 11.4% |
| West Indians | 18.4 /100 | #196 | Poor 11.4% |
| Somalis | 18.2 /100 | #197 | Poor 11.4% |
| Immigrants | Jamaica | 16.3 /100 | #198 | Poor 11.5% |
| Lebanese | 15.4 /100 | #199 | Poor 11.5% |
| Immigrants | Iraq | 13.0 /100 | #200 | Poor 11.5% |
| Immigrants | Panama | 13.0 /100 | #201 | Poor 11.5% |
| Immigrants | Mexico | 12.6 /100 | #202 | Poor 11.5% |
| Jamaicans | 10.9 /100 | #203 | Poor 11.5% |