Okinawan vs West Indian Professional Degree
COMPARE
Okinawan
West Indian
Professional Degree
Professional Degree Comparison
Okinawans
West Indians
7.3%
PROFESSIONAL DEGREE
100.0/ 100
METRIC RATING
6th/ 347
METRIC RANK
4.1%
PROFESSIONAL DEGREE
9.8/ 100
METRIC RATING
216th/ 347
METRIC RANK
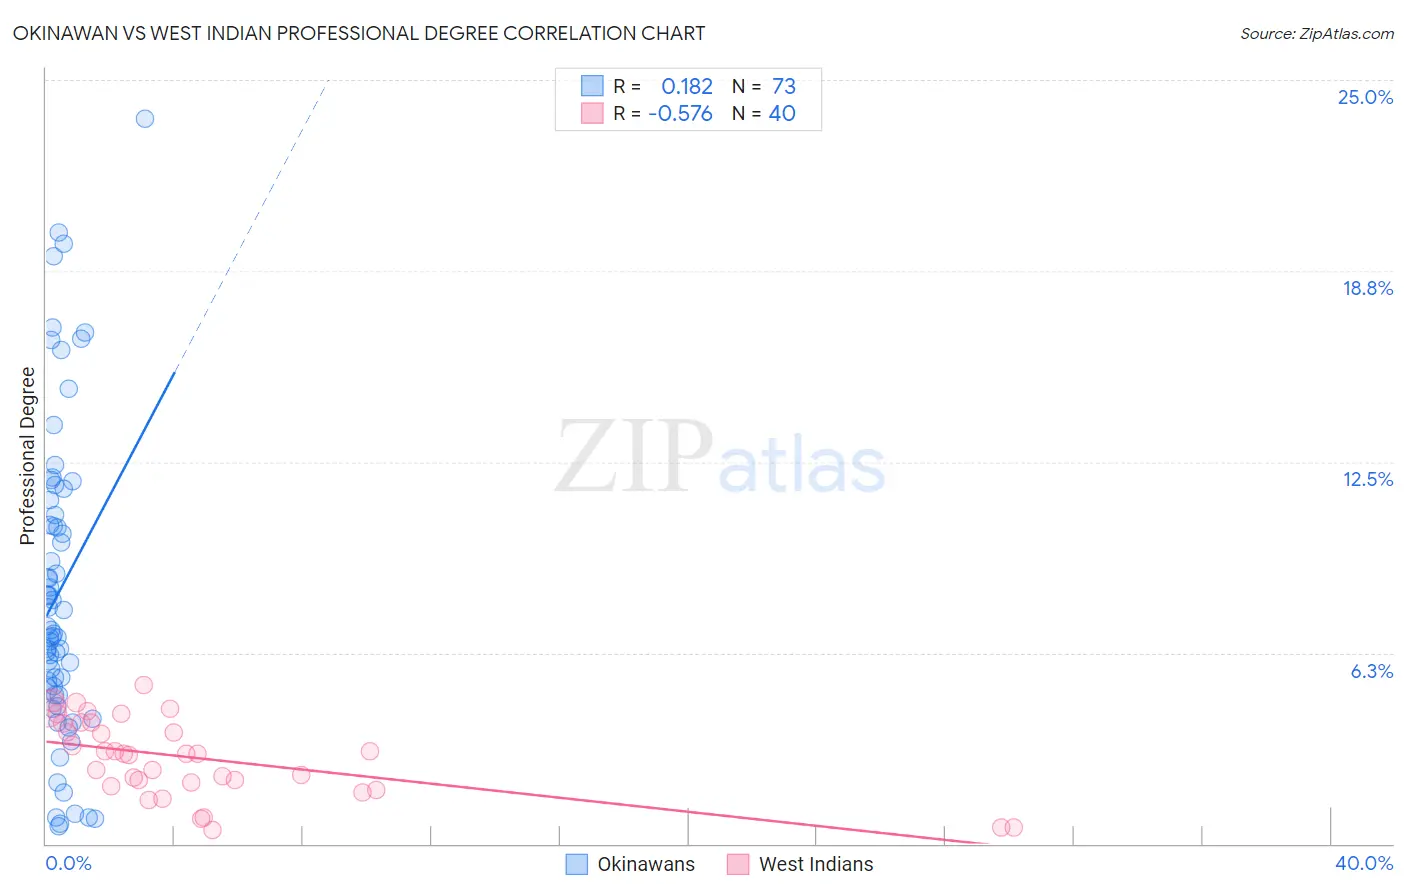
Okinawan vs West Indian Professional Degree Correlation Chart
The statistical analysis conducted on geographies consisting of 73,726,679 people shows a poor positive correlation between the proportion of Okinawans and percentage of population with at least professional degree education in the United States with a correlation coefficient (R) of 0.182 and weighted average of 7.3%. Similarly, the statistical analysis conducted on geographies consisting of 253,709,742 people shows a substantial negative correlation between the proportion of West Indians and percentage of population with at least professional degree education in the United States with a correlation coefficient (R) of -0.576 and weighted average of 4.1%, a difference of 80.7%.
Professional Degree Correlation Summary
| Measurement | Okinawan | West Indian |
| Minimum | 0.58% | 0.46% |
| Maximum | 23.7% | 5.2% |
| Range | 23.1% | 4.7% |
| Mean | 8.3% | 2.8% |
| Median | 7.0% | 2.9% |
| Interquartile 25% (IQ1) | 5.0% | 1.9% |
| Interquartile 75% (IQ3) | 11.0% | 3.9% |
| Interquartile Range (IQR) | 6.0% | 2.0% |
| Standard Deviation (Sample) | 5.1% | 1.3% |
| Standard Deviation (Population) | 5.0% | 1.3% |
Similar Demographics by Professional Degree
Demographics Similar to Okinawans by Professional Degree
In terms of professional degree, the demographic groups most similar to Okinawans are Immigrants from Iran (7.3%, a difference of 0.11%), Eastern European (7.1%, a difference of 3.2%), Immigrants from Switzerland (7.1%, a difference of 3.3%), Filipino (7.6%, a difference of 3.4%), and Immigrants from Taiwan (7.1%, a difference of 3.5%).
| Demographics | Rating | Rank | Professional Degree |
| Immigrants | Israel | 100.0 /100 | #1 | Exceptional 7.9% |
| Immigrants | Singapore | 100.0 /100 | #2 | Exceptional 7.7% |
| Iranians | 100.0 /100 | #3 | Exceptional 7.6% |
| Filipinos | 100.0 /100 | #4 | Exceptional 7.6% |
| Immigrants | Iran | 100.0 /100 | #5 | Exceptional 7.3% |
| Okinawans | 100.0 /100 | #6 | Exceptional 7.3% |
| Eastern Europeans | 100.0 /100 | #7 | Exceptional 7.1% |
| Immigrants | Switzerland | 100.0 /100 | #8 | Exceptional 7.1% |
| Immigrants | Taiwan | 100.0 /100 | #9 | Exceptional 7.1% |
| Immigrants | Belgium | 100.0 /100 | #10 | Exceptional 7.0% |
| Cypriots | 100.0 /100 | #11 | Exceptional 6.9% |
| Israelis | 100.0 /100 | #12 | Exceptional 6.9% |
| Immigrants | Australia | 100.0 /100 | #13 | Exceptional 6.9% |
| Immigrants | France | 100.0 /100 | #14 | Exceptional 6.8% |
| Immigrants | China | 100.0 /100 | #15 | Exceptional 6.7% |
Demographics Similar to West Indians by Professional Degree
In terms of professional degree, the demographic groups most similar to West Indians are Immigrants from Vietnam (4.0%, a difference of 0.16%), Portuguese (4.1%, a difference of 0.31%), Immigrants from Ghana (4.1%, a difference of 0.37%), Dutch (4.0%, a difference of 0.37%), and Immigrants from South Eastern Asia (4.0%, a difference of 0.40%).
| Demographics | Rating | Rank | Professional Degree |
| Immigrants | Panama | 12.3 /100 | #209 | Poor 4.1% |
| Immigrants | Nigeria | 11.7 /100 | #210 | Poor 4.1% |
| Germans | 11.6 /100 | #211 | Poor 4.1% |
| Whites/Caucasians | 11.2 /100 | #212 | Poor 4.1% |
| Koreans | 10.7 /100 | #213 | Poor 4.1% |
| Immigrants | Ghana | 10.6 /100 | #214 | Poor 4.1% |
| Portuguese | 10.5 /100 | #215 | Poor 4.1% |
| West Indians | 9.8 /100 | #216 | Tragic 4.1% |
| Immigrants | Vietnam | 9.4 /100 | #217 | Tragic 4.0% |
| Dutch | 9.0 /100 | #218 | Tragic 4.0% |
| Immigrants | South Eastern Asia | 8.9 /100 | #219 | Tragic 4.0% |
| Ute | 8.2 /100 | #220 | Tragic 4.0% |
| French Canadians | 8.0 /100 | #221 | Tragic 4.0% |
| Immigrants | Western Africa | 7.5 /100 | #222 | Tragic 4.0% |
| Immigrants | Bosnia and Herzegovina | 7.4 /100 | #223 | Tragic 4.0% |