Okinawan vs Immigrants from Spain Seniors Poverty Over the Age of 65
COMPARE
Okinawan
Immigrants from Spain
Seniors Poverty Over the Age of 65
Seniors Poverty Over the Age of 65 Comparison
Okinawans
Immigrants from Spain
10.4%
SENIORS POVERTY OVER THE AGE OF 65
91.7/ 100
METRIC RATING
118th/ 347
METRIC RANK
12.1%
SENIORS POVERTY OVER THE AGE OF 65
1.0/ 100
METRIC RATING
239th/ 347
METRIC RANK
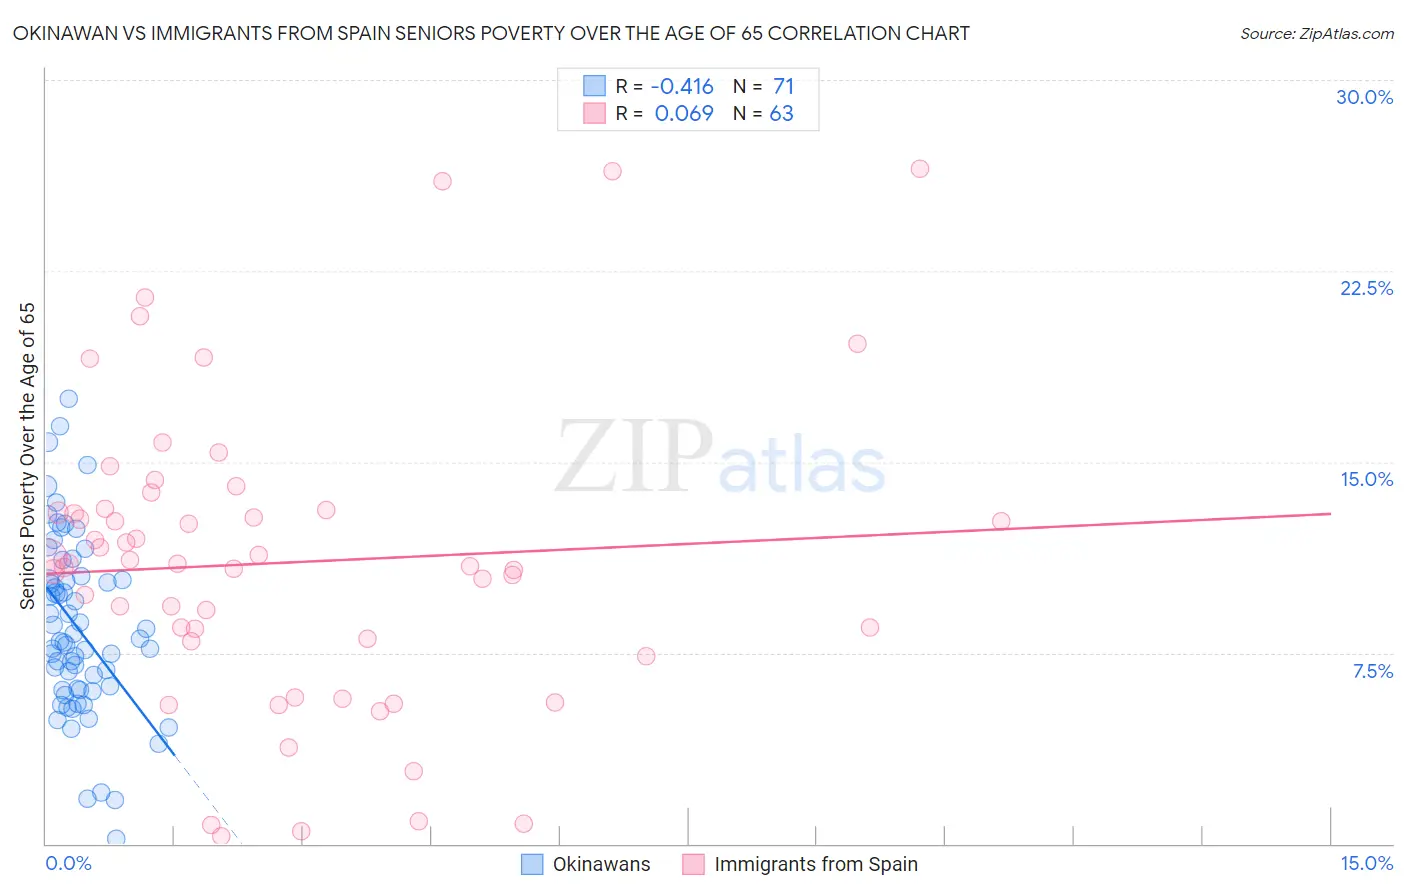
Okinawan vs Immigrants from Spain Seniors Poverty Over the Age of 65 Correlation Chart
The statistical analysis conducted on geographies consisting of 73,626,507 people shows a moderate negative correlation between the proportion of Okinawans and poverty level among seniors over the age of 65 in the United States with a correlation coefficient (R) of -0.416 and weighted average of 10.4%. Similarly, the statistical analysis conducted on geographies consisting of 239,231,314 people shows a slight positive correlation between the proportion of Immigrants from Spain and poverty level among seniors over the age of 65 in the United States with a correlation coefficient (R) of 0.069 and weighted average of 12.1%, a difference of 16.5%.
Seniors Poverty Over the Age of 65 Correlation Summary
| Measurement | Okinawan | Immigrants from Spain |
| Minimum | 0.21% | 0.30% |
| Maximum | 17.5% | 26.5% |
| Range | 17.3% | 26.2% |
| Mean | 8.5% | 11.0% |
| Median | 8.0% | 11.0% |
| Interquartile 25% (IQ1) | 6.0% | 7.9% |
| Interquartile 75% (IQ3) | 10.4% | 13.1% |
| Interquartile Range (IQR) | 4.4% | 5.2% |
| Standard Deviation (Sample) | 3.5% | 5.9% |
| Standard Deviation (Population) | 3.4% | 5.9% |
Similar Demographics by Seniors Poverty Over the Age of 65
Demographics Similar to Okinawans by Seniors Poverty Over the Age of 65
In terms of seniors poverty over the age of 65, the demographic groups most similar to Okinawans are Lebanese (10.3%, a difference of 0.080%), Pakistani (10.3%, a difference of 0.14%), Immigrants from Western Europe (10.4%, a difference of 0.19%), Immigrants from Bosnia and Herzegovina (10.4%, a difference of 0.26%), and Immigrants from Italy (10.3%, a difference of 0.29%).
| Demographics | Rating | Rank | Seniors Poverty Over the Age of 65 |
| Immigrants | Belgium | 93.4 /100 | #111 | Exceptional 10.3% |
| Immigrants | Korea | 93.3 /100 | #112 | Exceptional 10.3% |
| Immigrants | Romania | 93.3 /100 | #113 | Exceptional 10.3% |
| Immigrants | Denmark | 92.7 /100 | #114 | Exceptional 10.3% |
| Immigrants | Italy | 92.6 /100 | #115 | Exceptional 10.3% |
| Pakistanis | 92.2 /100 | #116 | Exceptional 10.3% |
| Lebanese | 92.0 /100 | #117 | Exceptional 10.3% |
| Okinawans | 91.7 /100 | #118 | Exceptional 10.4% |
| Immigrants | Western Europe | 91.1 /100 | #119 | Exceptional 10.4% |
| Immigrants | Bosnia and Herzegovina | 90.8 /100 | #120 | Exceptional 10.4% |
| Immigrants | Iraq | 90.7 /100 | #121 | Exceptional 10.4% |
| Immigrants | Moldova | 90.7 /100 | #122 | Exceptional 10.4% |
| Hmong | 90.0 /100 | #123 | Exceptional 10.4% |
| Asians | 89.9 /100 | #124 | Excellent 10.4% |
| Immigrants | Philippines | 89.4 /100 | #125 | Excellent 10.4% |
Demographics Similar to Immigrants from Spain by Seniors Poverty Over the Age of 65
In terms of seniors poverty over the age of 65, the demographic groups most similar to Immigrants from Spain are Comanche (12.1%, a difference of 0.10%), Immigrants from Albania (12.1%, a difference of 0.12%), Subsaharan African (12.1%, a difference of 0.16%), Seminole (12.0%, a difference of 0.26%), and Uruguayan (12.1%, a difference of 0.29%).
| Demographics | Rating | Rank | Seniors Poverty Over the Age of 65 |
| Yaqui | 1.9 /100 | #232 | Tragic 11.9% |
| Panamanians | 1.8 /100 | #233 | Tragic 11.9% |
| Iroquois | 1.7 /100 | #234 | Tragic 11.9% |
| Immigrants | Argentina | 1.3 /100 | #235 | Tragic 12.0% |
| Immigrants | Peru | 1.3 /100 | #236 | Tragic 12.0% |
| Moroccans | 1.2 /100 | #237 | Tragic 12.0% |
| Seminole | 1.1 /100 | #238 | Tragic 12.0% |
| Immigrants | Spain | 1.0 /100 | #239 | Tragic 12.1% |
| Comanche | 0.9 /100 | #240 | Tragic 12.1% |
| Immigrants | Albania | 0.9 /100 | #241 | Tragic 12.1% |
| Sub-Saharan Africans | 0.9 /100 | #242 | Tragic 12.1% |
| Uruguayans | 0.8 /100 | #243 | Tragic 12.1% |
| Immigrants | Portugal | 0.8 /100 | #244 | Tragic 12.1% |
| Chippewa | 0.7 /100 | #245 | Tragic 12.1% |
| Cree | 0.7 /100 | #246 | Tragic 12.1% |