Okinawan vs Immigrants from Australia Disability Age Under 5
COMPARE
Okinawan
Immigrants from Australia
Disability Age Under 5
Disability Age Under 5 Comparison
Okinawans
Immigrants from Australia
1.1%
DISABILITY AGE UNDER 5
97.6/ 100
METRIC RATING
86th/ 347
METRIC RANK
1.2%
DISABILITY AGE UNDER 5
94.4/ 100
METRIC RATING
112th/ 347
METRIC RANK
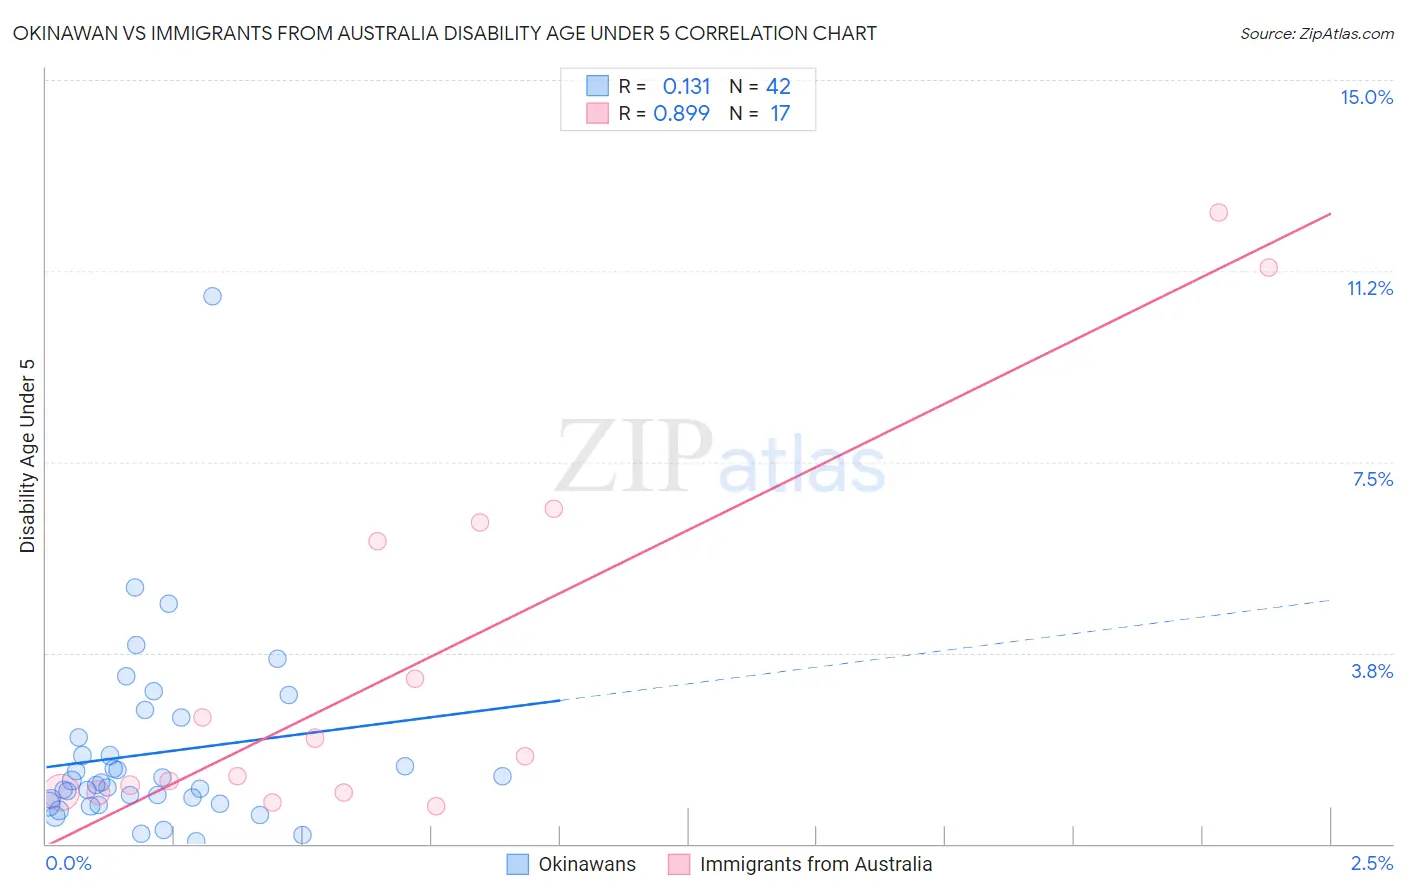
Okinawan vs Immigrants from Australia Disability Age Under 5 Correlation Chart
The statistical analysis conducted on geographies consisting of 59,482,262 people shows a poor positive correlation between the proportion of Okinawans and percentage of population with a disability under the age of 5 in the United States with a correlation coefficient (R) of 0.131 and weighted average of 1.1%. Similarly, the statistical analysis conducted on geographies consisting of 143,101,836 people shows a very strong positive correlation between the proportion of Immigrants from Australia and percentage of population with a disability under the age of 5 in the United States with a correlation coefficient (R) of 0.899 and weighted average of 1.2%, a difference of 2.2%.
Disability Age Under 5 Correlation Summary
| Measurement | Okinawan | Immigrants from Australia |
| Minimum | 0.058% | 0.73% |
| Maximum | 10.8% | 12.4% |
| Range | 10.7% | 11.7% |
| Mean | 1.8% | 3.5% |
| Median | 1.2% | 1.7% |
| Interquartile 25% (IQ1) | 0.80% | 1.0% |
| Interquartile 75% (IQ3) | 2.1% | 6.1% |
| Interquartile Range (IQR) | 1.3% | 5.1% |
| Standard Deviation (Sample) | 1.8% | 3.7% |
| Standard Deviation (Population) | 1.8% | 3.6% |
Similar Demographics by Disability Age Under 5
Demographics Similar to Okinawans by Disability Age Under 5
In terms of disability age under 5, the demographic groups most similar to Okinawans are Ugandan (1.1%, a difference of 0.020%), Immigrants from Dominican Republic (1.1%, a difference of 0.040%), Sudanese (1.1%, a difference of 0.13%), Immigrants from Zaire (1.1%, a difference of 0.20%), and Ethiopian (1.1%, a difference of 0.32%).
| Demographics | Rating | Rank | Disability Age Under 5 |
| Hmong | 98.0 /100 | #79 | Exceptional 1.1% |
| Immigrants | Trinidad and Tobago | 98.0 /100 | #80 | Exceptional 1.1% |
| Turks | 98.0 /100 | #81 | Exceptional 1.1% |
| Immigrants | Jordan | 97.9 /100 | #82 | Exceptional 1.1% |
| Immigrants | Syria | 97.9 /100 | #83 | Exceptional 1.1% |
| Immigrants | Zaire | 97.8 /100 | #84 | Exceptional 1.1% |
| Sudanese | 97.7 /100 | #85 | Exceptional 1.1% |
| Okinawans | 97.6 /100 | #86 | Exceptional 1.1% |
| Ugandans | 97.5 /100 | #87 | Exceptional 1.1% |
| Immigrants | Dominican Republic | 97.5 /100 | #88 | Exceptional 1.1% |
| Ethiopians | 97.2 /100 | #89 | Exceptional 1.1% |
| Chinese | 97.2 /100 | #90 | Exceptional 1.1% |
| Albanians | 97.2 /100 | #91 | Exceptional 1.1% |
| Immigrants | Cuba | 97.0 /100 | #92 | Exceptional 1.1% |
| Spanish Americans | 96.9 /100 | #93 | Exceptional 1.1% |
Demographics Similar to Immigrants from Australia by Disability Age Under 5
In terms of disability age under 5, the demographic groups most similar to Immigrants from Australia are Immigrants from Oceania (1.2%, a difference of 0.060%), Senegalese (1.2%, a difference of 0.11%), Belizean (1.2%, a difference of 0.21%), Immigrants from Caribbean (1.2%, a difference of 0.22%), and Immigrants from Northern Africa (1.2%, a difference of 0.24%).
| Demographics | Rating | Rank | Disability Age Under 5 |
| Immigrants | South Africa | 95.6 /100 | #105 | Exceptional 1.2% |
| Cambodians | 95.4 /100 | #106 | Exceptional 1.2% |
| Immigrants | West Indies | 95.3 /100 | #107 | Exceptional 1.2% |
| Iraqis | 95.1 /100 | #108 | Exceptional 1.2% |
| Immigrants | Panama | 95.0 /100 | #109 | Exceptional 1.2% |
| Immigrants | Lebanon | 95.0 /100 | #110 | Exceptional 1.2% |
| Senegalese | 94.6 /100 | #111 | Exceptional 1.2% |
| Immigrants | Australia | 94.4 /100 | #112 | Exceptional 1.2% |
| Immigrants | Oceania | 94.2 /100 | #113 | Exceptional 1.2% |
| Belizeans | 93.9 /100 | #114 | Exceptional 1.2% |
| Immigrants | Caribbean | 93.8 /100 | #115 | Exceptional 1.2% |
| Immigrants | Northern Africa | 93.8 /100 | #116 | Exceptional 1.2% |
| Immigrants | Philippines | 93.5 /100 | #117 | Exceptional 1.2% |
| Immigrants | Venezuela | 93.4 /100 | #118 | Exceptional 1.2% |
| Bhutanese | 92.5 /100 | #119 | Exceptional 1.2% |