Norwegian vs Moroccan Cognitive Disability
COMPARE
Norwegian
Moroccan
Cognitive Disability
Cognitive Disability Comparison
Norwegians
Moroccans
16.5%
COGNITIVE DISABILITY
99.8/ 100
METRIC RATING
50th/ 347
METRIC RANK
17.6%
COGNITIVE DISABILITY
5.9/ 100
METRIC RATING
221st/ 347
METRIC RANK
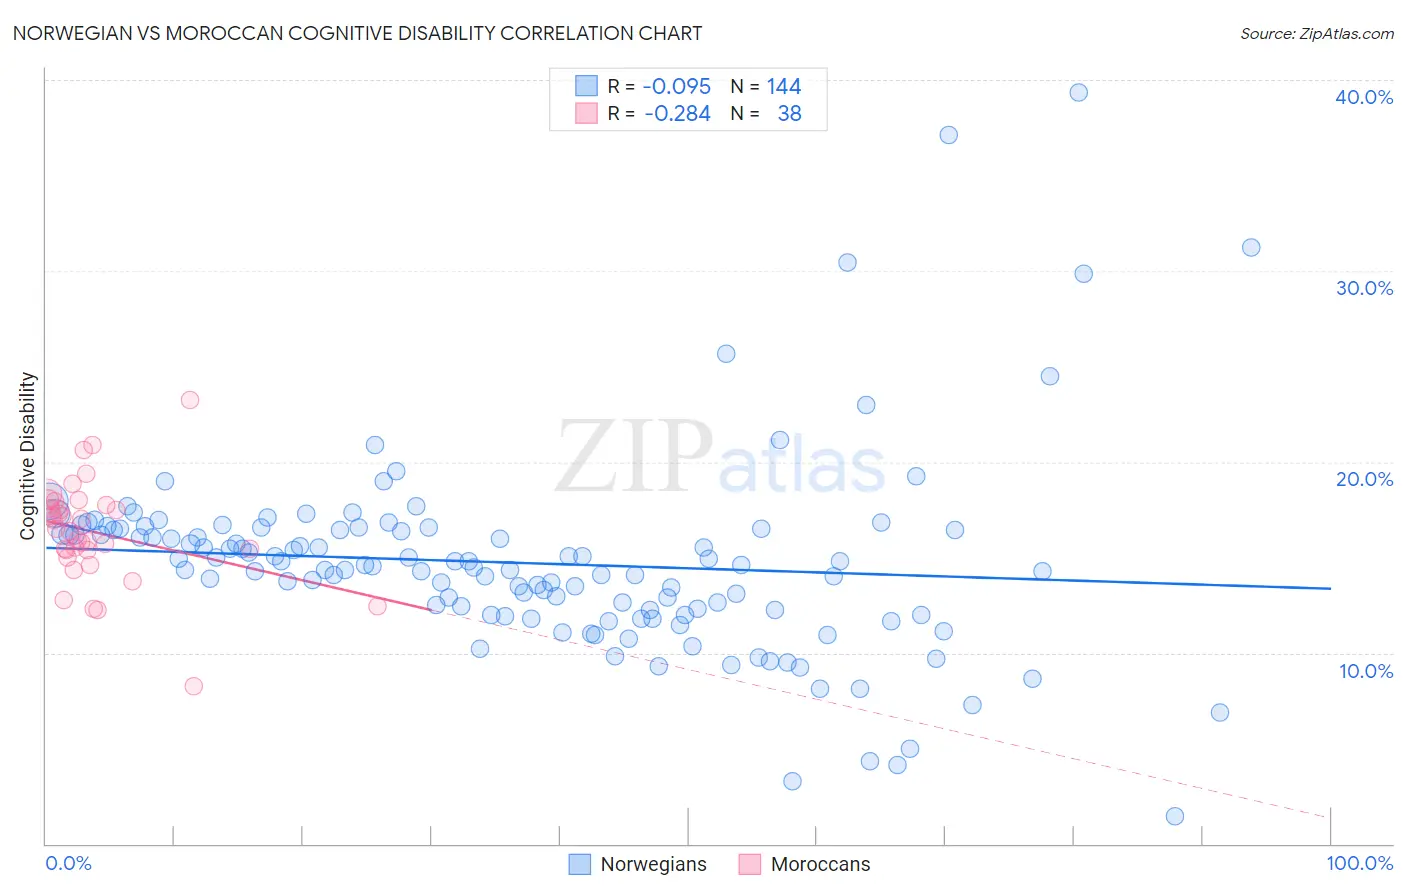
Norwegian vs Moroccan Cognitive Disability Correlation Chart
The statistical analysis conducted on geographies consisting of 533,251,641 people shows a slight negative correlation between the proportion of Norwegians and percentage of population with cognitive disability in the United States with a correlation coefficient (R) of -0.095 and weighted average of 16.5%. Similarly, the statistical analysis conducted on geographies consisting of 201,805,523 people shows a weak negative correlation between the proportion of Moroccans and percentage of population with cognitive disability in the United States with a correlation coefficient (R) of -0.284 and weighted average of 17.6%, a difference of 6.8%.
Cognitive Disability Correlation Summary
| Measurement | Norwegian | Moroccan |
| Minimum | 1.5% | 8.3% |
| Maximum | 39.3% | 23.2% |
| Range | 37.9% | 15.0% |
| Mean | 14.7% | 16.3% |
| Median | 14.6% | 16.4% |
| Interquartile 25% (IQ1) | 12.1% | 15.4% |
| Interquartile 75% (IQ3) | 16.5% | 17.7% |
| Interquartile Range (IQR) | 4.4% | 2.3% |
| Standard Deviation (Sample) | 5.2% | 2.7% |
| Standard Deviation (Population) | 5.1% | 2.7% |
Similar Demographics by Cognitive Disability
Demographics Similar to Norwegians by Cognitive Disability
In terms of cognitive disability, the demographic groups most similar to Norwegians are Iranian (16.5%, a difference of 0.010%), Immigrants from Italy (16.5%, a difference of 0.050%), Immigrants from North America (16.5%, a difference of 0.050%), Immigrants from Korea (16.5%, a difference of 0.050%), and Immigrants from Colombia (16.5%, a difference of 0.080%).
| Demographics | Rating | Rank | Cognitive Disability |
| Immigrants | Canada | 99.8 /100 | #43 | Exceptional 16.5% |
| Macedonians | 99.8 /100 | #44 | Exceptional 16.5% |
| Immigrants | Europe | 99.8 /100 | #45 | Exceptional 16.5% |
| Immigrants | Colombia | 99.8 /100 | #46 | Exceptional 16.5% |
| Immigrants | Italy | 99.8 /100 | #47 | Exceptional 16.5% |
| Immigrants | North America | 99.8 /100 | #48 | Exceptional 16.5% |
| Iranians | 99.8 /100 | #49 | Exceptional 16.5% |
| Norwegians | 99.8 /100 | #50 | Exceptional 16.5% |
| Immigrants | Korea | 99.8 /100 | #51 | Exceptional 16.5% |
| Soviet Union | 99.8 /100 | #52 | Exceptional 16.5% |
| Swedes | 99.8 /100 | #53 | Exceptional 16.5% |
| Immigrants | Iran | 99.8 /100 | #54 | Exceptional 16.5% |
| Immigrants | Venezuela | 99.7 /100 | #55 | Exceptional 16.5% |
| Austrians | 99.7 /100 | #56 | Exceptional 16.6% |
| Bhutanese | 99.7 /100 | #57 | Exceptional 16.6% |
Demographics Similar to Moroccans by Cognitive Disability
In terms of cognitive disability, the demographic groups most similar to Moroccans are Zimbabwean (17.6%, a difference of 0.020%), Icelander (17.6%, a difference of 0.050%), Immigrants from Sierra Leone (17.6%, a difference of 0.050%), Salvadoran (17.6%, a difference of 0.090%), and Okinawan (17.6%, a difference of 0.10%).
| Demographics | Rating | Rank | Cognitive Disability |
| Immigrants | El Salvador | 7.0 /100 | #214 | Tragic 17.6% |
| Alaskan Athabascans | 6.9 /100 | #215 | Tragic 17.6% |
| Okinawans | 6.8 /100 | #216 | Tragic 17.6% |
| Salvadorans | 6.7 /100 | #217 | Tragic 17.6% |
| Icelanders | 6.4 /100 | #218 | Tragic 17.6% |
| Immigrants | Sierra Leone | 6.3 /100 | #219 | Tragic 17.6% |
| Zimbabweans | 6.1 /100 | #220 | Tragic 17.6% |
| Moroccans | 5.9 /100 | #221 | Tragic 17.6% |
| Central Americans | 4.5 /100 | #222 | Tragic 17.7% |
| Alsatians | 4.5 /100 | #223 | Tragic 17.7% |
| Fijians | 3.4 /100 | #224 | Tragic 17.7% |
| Vietnamese | 3.4 /100 | #225 | Tragic 17.7% |
| Marshallese | 2.7 /100 | #226 | Tragic 17.7% |
| Immigrants | St. Vincent and the Grenadines | 2.6 /100 | #227 | Tragic 17.7% |
| Immigrants | Central America | 2.3 /100 | #228 | Tragic 17.7% |