Norwegian vs Immigrants from Ethiopia Cognitive Disability
COMPARE
Norwegian
Immigrants from Ethiopia
Cognitive Disability
Cognitive Disability Comparison
Norwegians
Immigrants from Ethiopia
16.5%
COGNITIVE DISABILITY
99.8/ 100
METRIC RATING
50th/ 347
METRIC RANK
17.9%
COGNITIVE DISABILITY
0.7/ 100
METRIC RATING
250th/ 347
METRIC RANK
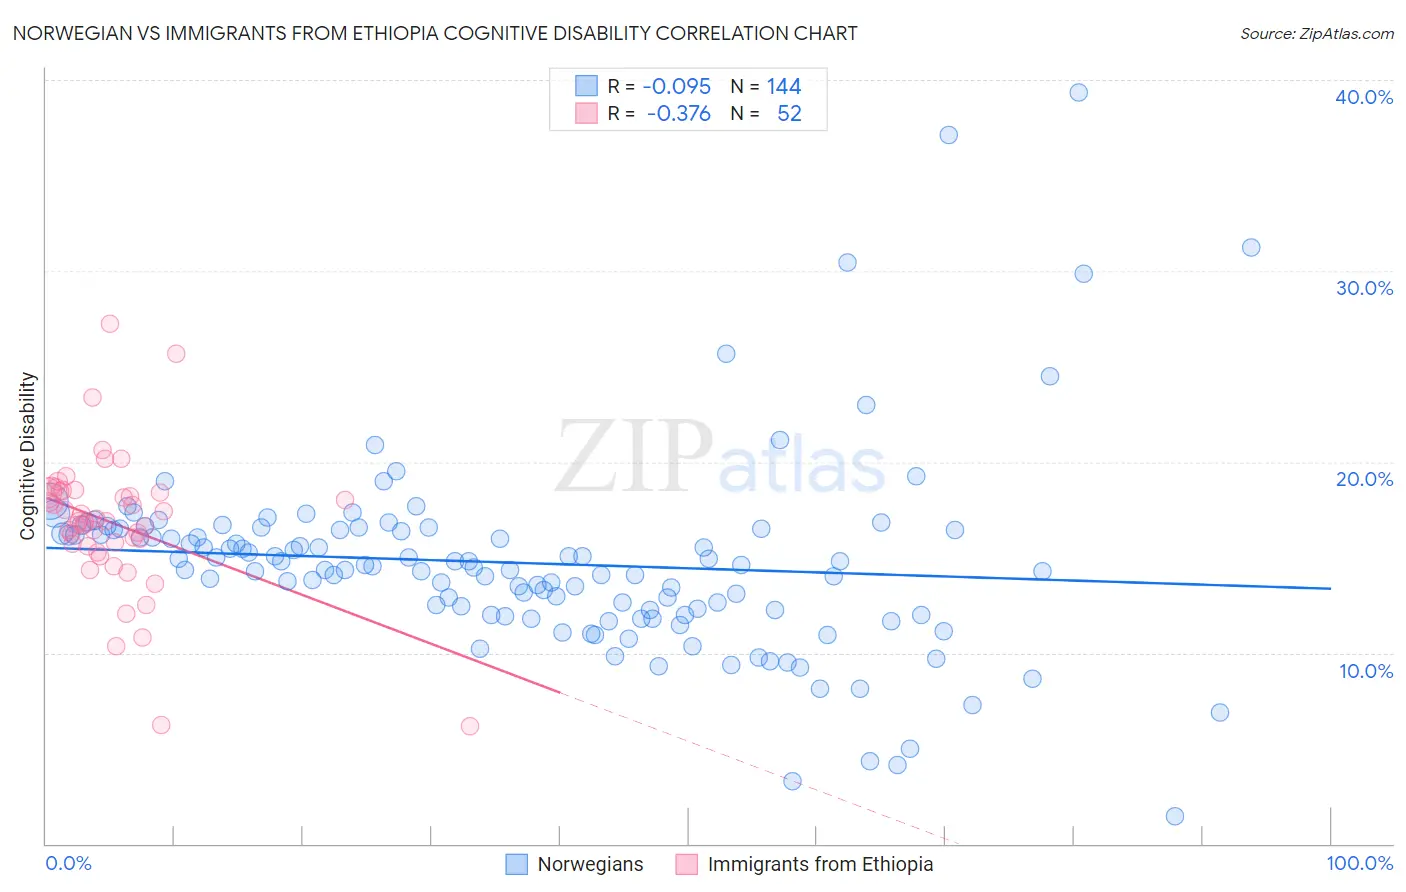
Norwegian vs Immigrants from Ethiopia Cognitive Disability Correlation Chart
The statistical analysis conducted on geographies consisting of 533,251,641 people shows a slight negative correlation between the proportion of Norwegians and percentage of population with cognitive disability in the United States with a correlation coefficient (R) of -0.095 and weighted average of 16.5%. Similarly, the statistical analysis conducted on geographies consisting of 211,556,639 people shows a mild negative correlation between the proportion of Immigrants from Ethiopia and percentage of population with cognitive disability in the United States with a correlation coefficient (R) of -0.376 and weighted average of 17.9%, a difference of 8.4%.
Cognitive Disability Correlation Summary
| Measurement | Norwegian | Immigrants from Ethiopia |
| Minimum | 1.5% | 6.2% |
| Maximum | 39.3% | 27.2% |
| Range | 37.9% | 21.1% |
| Mean | 14.7% | 16.8% |
| Median | 14.6% | 16.9% |
| Interquartile 25% (IQ1) | 12.1% | 15.6% |
| Interquartile 75% (IQ3) | 16.5% | 18.4% |
| Interquartile Range (IQR) | 4.4% | 2.8% |
| Standard Deviation (Sample) | 5.2% | 3.7% |
| Standard Deviation (Population) | 5.1% | 3.6% |
Similar Demographics by Cognitive Disability
Demographics Similar to Norwegians by Cognitive Disability
In terms of cognitive disability, the demographic groups most similar to Norwegians are Iranian (16.5%, a difference of 0.010%), Immigrants from Italy (16.5%, a difference of 0.050%), Immigrants from North America (16.5%, a difference of 0.050%), Immigrants from Korea (16.5%, a difference of 0.050%), and Immigrants from Colombia (16.5%, a difference of 0.080%).
| Demographics | Rating | Rank | Cognitive Disability |
| Immigrants | Canada | 99.8 /100 | #43 | Exceptional 16.5% |
| Macedonians | 99.8 /100 | #44 | Exceptional 16.5% |
| Immigrants | Europe | 99.8 /100 | #45 | Exceptional 16.5% |
| Immigrants | Colombia | 99.8 /100 | #46 | Exceptional 16.5% |
| Immigrants | Italy | 99.8 /100 | #47 | Exceptional 16.5% |
| Immigrants | North America | 99.8 /100 | #48 | Exceptional 16.5% |
| Iranians | 99.8 /100 | #49 | Exceptional 16.5% |
| Norwegians | 99.8 /100 | #50 | Exceptional 16.5% |
| Immigrants | Korea | 99.8 /100 | #51 | Exceptional 16.5% |
| Soviet Union | 99.8 /100 | #52 | Exceptional 16.5% |
| Swedes | 99.8 /100 | #53 | Exceptional 16.5% |
| Immigrants | Iran | 99.8 /100 | #54 | Exceptional 16.5% |
| Immigrants | Venezuela | 99.7 /100 | #55 | Exceptional 16.5% |
| Austrians | 99.7 /100 | #56 | Exceptional 16.6% |
| Bhutanese | 99.7 /100 | #57 | Exceptional 16.6% |
Demographics Similar to Immigrants from Ethiopia by Cognitive Disability
In terms of cognitive disability, the demographic groups most similar to Immigrants from Ethiopia are Cree (17.9%, a difference of 0.0%), Malaysian (17.9%, a difference of 0.010%), Immigrants from Grenada (17.9%, a difference of 0.020%), Hopi (17.9%, a difference of 0.030%), and Hispanic or Latino (17.9%, a difference of 0.030%).
| Demographics | Rating | Rank | Cognitive Disability |
| Immigrants | Bangladesh | 1.0 /100 | #243 | Tragic 17.8% |
| Jamaicans | 0.9 /100 | #244 | Tragic 17.9% |
| Trinidadians and Tobagonians | 0.8 /100 | #245 | Tragic 17.9% |
| Immigrants | Thailand | 0.8 /100 | #246 | Tragic 17.9% |
| Samoans | 0.7 /100 | #247 | Tragic 17.9% |
| French American Indians | 0.7 /100 | #248 | Tragic 17.9% |
| Cree | 0.7 /100 | #249 | Tragic 17.9% |
| Immigrants | Ethiopia | 0.7 /100 | #250 | Tragic 17.9% |
| Malaysians | 0.6 /100 | #251 | Tragic 17.9% |
| Immigrants | Grenada | 0.6 /100 | #252 | Tragic 17.9% |
| Hopi | 0.6 /100 | #253 | Tragic 17.9% |
| Hispanics or Latinos | 0.6 /100 | #254 | Tragic 17.9% |
| Immigrants | Azores | 0.6 /100 | #255 | Tragic 17.9% |
| Bahamians | 0.6 /100 | #256 | Tragic 17.9% |
| Mexican American Indians | 0.6 /100 | #257 | Tragic 17.9% |