American vs Moroccan Cognitive Disability
COMPARE
American
Moroccan
Cognitive Disability
Cognitive Disability Comparison
Americans
Moroccans
17.2%
COGNITIVE DISABILITY
72.2/ 100
METRIC RATING
161st/ 347
METRIC RANK
17.6%
COGNITIVE DISABILITY
5.9/ 100
METRIC RATING
221st/ 347
METRIC RANK
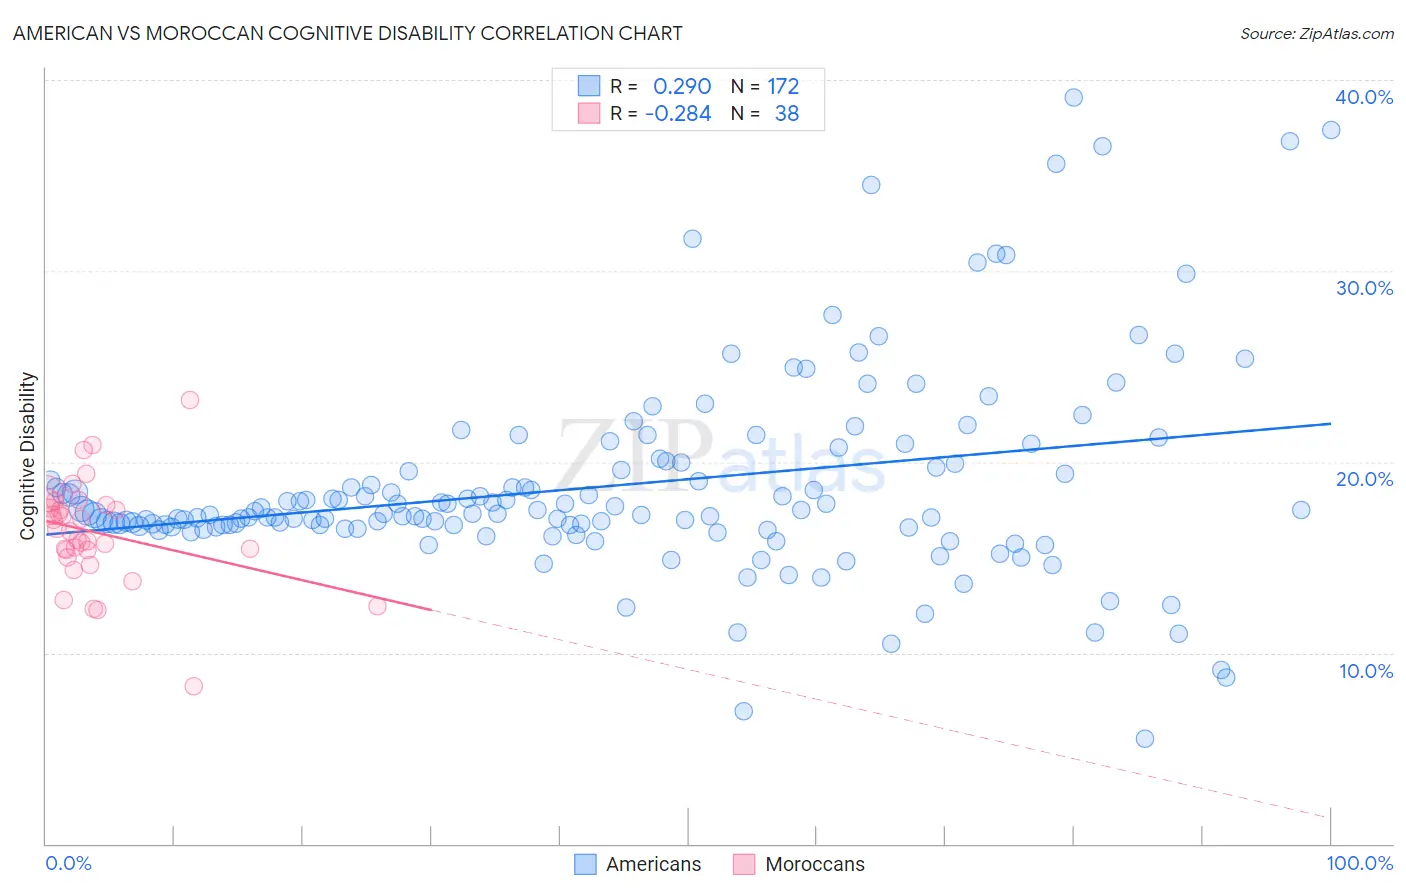
American vs Moroccan Cognitive Disability Correlation Chart
The statistical analysis conducted on geographies consisting of 581,739,029 people shows a weak positive correlation between the proportion of Americans and percentage of population with cognitive disability in the United States with a correlation coefficient (R) of 0.290 and weighted average of 17.2%. Similarly, the statistical analysis conducted on geographies consisting of 201,805,523 people shows a weak negative correlation between the proportion of Moroccans and percentage of population with cognitive disability in the United States with a correlation coefficient (R) of -0.284 and weighted average of 17.6%, a difference of 2.7%.
Cognitive Disability Correlation Summary
| Measurement | American | Moroccan |
| Minimum | 5.5% | 8.3% |
| Maximum | 39.1% | 23.2% |
| Range | 33.6% | 15.0% |
| Mean | 18.8% | 16.3% |
| Median | 17.3% | 16.4% |
| Interquartile 25% (IQ1) | 16.6% | 15.4% |
| Interquartile 75% (IQ3) | 19.8% | 17.7% |
| Interquartile Range (IQR) | 3.2% | 2.3% |
| Standard Deviation (Sample) | 5.3% | 2.7% |
| Standard Deviation (Population) | 5.3% | 2.7% |
Similar Demographics by Cognitive Disability
Demographics Similar to Americans by Cognitive Disability
In terms of cognitive disability, the demographic groups most similar to Americans are Australian (17.2%, a difference of 0.010%), Yugoslavian (17.2%, a difference of 0.020%), Immigrants from Switzerland (17.2%, a difference of 0.020%), Immigrants from Latvia (17.2%, a difference of 0.040%), and Celtic (17.1%, a difference of 0.070%).
| Demographics | Rating | Rank | Cognitive Disability |
| Immigrants | Malaysia | 79.3 /100 | #154 | Good 17.1% |
| Brazilians | 78.9 /100 | #155 | Good 17.1% |
| Sri Lankans | 78.9 /100 | #156 | Good 17.1% |
| Immigrants | Australia | 76.0 /100 | #157 | Good 17.1% |
| Celtics | 74.1 /100 | #158 | Good 17.1% |
| Immigrants | Latvia | 73.2 /100 | #159 | Good 17.2% |
| Australians | 72.4 /100 | #160 | Good 17.2% |
| Americans | 72.2 /100 | #161 | Good 17.2% |
| Yugoslavians | 71.6 /100 | #162 | Good 17.2% |
| Immigrants | Switzerland | 71.5 /100 | #163 | Good 17.2% |
| Armenians | 70.1 /100 | #164 | Good 17.2% |
| Immigrants | Albania | 64.9 /100 | #165 | Good 17.2% |
| Immigrants | Ecuador | 64.4 /100 | #166 | Good 17.2% |
| Immigrants | Syria | 63.5 /100 | #167 | Good 17.2% |
| Immigrants | Immigrants | 62.5 /100 | #168 | Good 17.2% |
Demographics Similar to Moroccans by Cognitive Disability
In terms of cognitive disability, the demographic groups most similar to Moroccans are Zimbabwean (17.6%, a difference of 0.020%), Icelander (17.6%, a difference of 0.050%), Immigrants from Sierra Leone (17.6%, a difference of 0.050%), Salvadoran (17.6%, a difference of 0.090%), and Okinawan (17.6%, a difference of 0.10%).
| Demographics | Rating | Rank | Cognitive Disability |
| Immigrants | El Salvador | 7.0 /100 | #214 | Tragic 17.6% |
| Alaskan Athabascans | 6.9 /100 | #215 | Tragic 17.6% |
| Okinawans | 6.8 /100 | #216 | Tragic 17.6% |
| Salvadorans | 6.7 /100 | #217 | Tragic 17.6% |
| Icelanders | 6.4 /100 | #218 | Tragic 17.6% |
| Immigrants | Sierra Leone | 6.3 /100 | #219 | Tragic 17.6% |
| Zimbabweans | 6.1 /100 | #220 | Tragic 17.6% |
| Moroccans | 5.9 /100 | #221 | Tragic 17.6% |
| Central Americans | 4.5 /100 | #222 | Tragic 17.7% |
| Alsatians | 4.5 /100 | #223 | Tragic 17.7% |
| Fijians | 3.4 /100 | #224 | Tragic 17.7% |
| Vietnamese | 3.4 /100 | #225 | Tragic 17.7% |
| Marshallese | 2.7 /100 | #226 | Tragic 17.7% |
| Immigrants | St. Vincent and the Grenadines | 2.6 /100 | #227 | Tragic 17.7% |
| Immigrants | Central America | 2.3 /100 | #228 | Tragic 17.7% |