Norwegian vs Immigrants from Burma/Myanmar Cognitive Disability
COMPARE
Norwegian
Immigrants from Burma/Myanmar
Cognitive Disability
Cognitive Disability Comparison
Norwegians
Immigrants from Burma/Myanmar
16.5%
COGNITIVE DISABILITY
99.8/ 100
METRIC RATING
50th/ 347
METRIC RANK
18.2%
COGNITIVE DISABILITY
0.0/ 100
METRIC RATING
296th/ 347
METRIC RANK
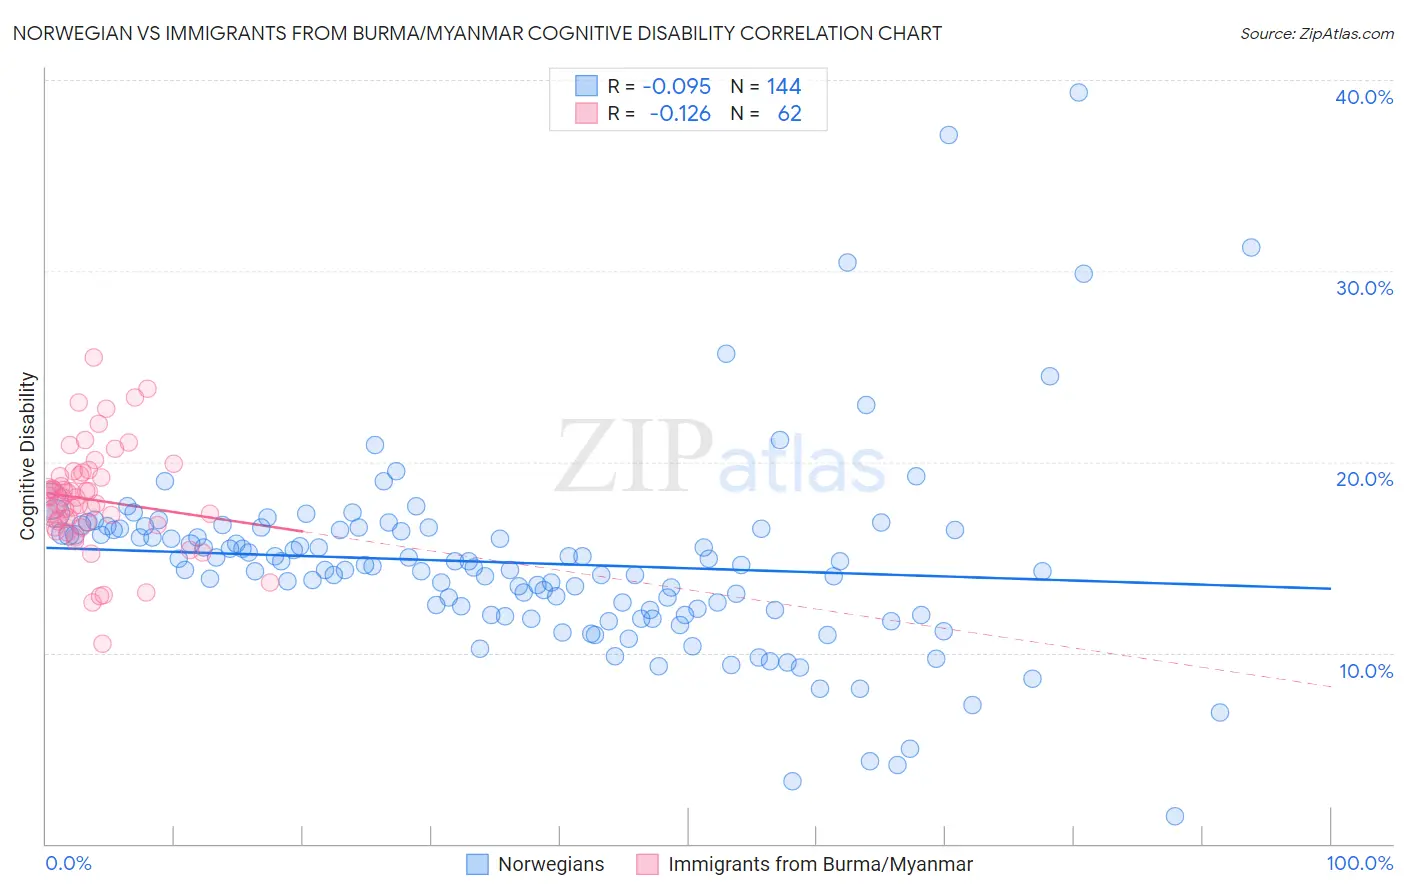
Norwegian vs Immigrants from Burma/Myanmar Cognitive Disability Correlation Chart
The statistical analysis conducted on geographies consisting of 533,251,641 people shows a slight negative correlation between the proportion of Norwegians and percentage of population with cognitive disability in the United States with a correlation coefficient (R) of -0.095 and weighted average of 16.5%. Similarly, the statistical analysis conducted on geographies consisting of 172,345,235 people shows a poor negative correlation between the proportion of Immigrants from Burma/Myanmar and percentage of population with cognitive disability in the United States with a correlation coefficient (R) of -0.126 and weighted average of 18.2%, a difference of 10.5%.
Cognitive Disability Correlation Summary
| Measurement | Norwegian | Immigrants from Burma/Myanmar |
| Minimum | 1.5% | 10.5% |
| Maximum | 39.3% | 25.5% |
| Range | 37.9% | 15.0% |
| Mean | 14.7% | 18.0% |
| Median | 14.6% | 18.0% |
| Interquartile 25% (IQ1) | 12.1% | 16.7% |
| Interquartile 75% (IQ3) | 16.5% | 19.3% |
| Interquartile Range (IQR) | 4.4% | 2.6% |
| Standard Deviation (Sample) | 5.2% | 2.8% |
| Standard Deviation (Population) | 5.1% | 2.7% |
Similar Demographics by Cognitive Disability
Demographics Similar to Norwegians by Cognitive Disability
In terms of cognitive disability, the demographic groups most similar to Norwegians are Iranian (16.5%, a difference of 0.010%), Immigrants from Italy (16.5%, a difference of 0.050%), Immigrants from North America (16.5%, a difference of 0.050%), Immigrants from Korea (16.5%, a difference of 0.050%), and Immigrants from Colombia (16.5%, a difference of 0.080%).
| Demographics | Rating | Rank | Cognitive Disability |
| Immigrants | Canada | 99.8 /100 | #43 | Exceptional 16.5% |
| Macedonians | 99.8 /100 | #44 | Exceptional 16.5% |
| Immigrants | Europe | 99.8 /100 | #45 | Exceptional 16.5% |
| Immigrants | Colombia | 99.8 /100 | #46 | Exceptional 16.5% |
| Immigrants | Italy | 99.8 /100 | #47 | Exceptional 16.5% |
| Immigrants | North America | 99.8 /100 | #48 | Exceptional 16.5% |
| Iranians | 99.8 /100 | #49 | Exceptional 16.5% |
| Norwegians | 99.8 /100 | #50 | Exceptional 16.5% |
| Immigrants | Korea | 99.8 /100 | #51 | Exceptional 16.5% |
| Soviet Union | 99.8 /100 | #52 | Exceptional 16.5% |
| Swedes | 99.8 /100 | #53 | Exceptional 16.5% |
| Immigrants | Iran | 99.8 /100 | #54 | Exceptional 16.5% |
| Immigrants | Venezuela | 99.7 /100 | #55 | Exceptional 16.5% |
| Austrians | 99.7 /100 | #56 | Exceptional 16.6% |
| Bhutanese | 99.7 /100 | #57 | Exceptional 16.6% |
Demographics Similar to Immigrants from Burma/Myanmar by Cognitive Disability
In terms of cognitive disability, the demographic groups most similar to Immigrants from Burma/Myanmar are German Russian (18.2%, a difference of 0.020%), Blackfeet (18.3%, a difference of 0.14%), Japanese (18.3%, a difference of 0.14%), Ghanaian (18.3%, a difference of 0.18%), and British West Indian (18.2%, a difference of 0.20%).
| Demographics | Rating | Rank | Cognitive Disability |
| Natives/Alaskans | 0.1 /100 | #289 | Tragic 18.1% |
| Immigrants | Africa | 0.1 /100 | #290 | Tragic 18.1% |
| Ottawa | 0.1 /100 | #291 | Tragic 18.2% |
| Iroquois | 0.1 /100 | #292 | Tragic 18.2% |
| Central American Indians | 0.1 /100 | #293 | Tragic 18.2% |
| British West Indians | 0.1 /100 | #294 | Tragic 18.2% |
| German Russians | 0.0 /100 | #295 | Tragic 18.2% |
| Immigrants | Burma/Myanmar | 0.0 /100 | #296 | Tragic 18.2% |
| Blackfeet | 0.0 /100 | #297 | Tragic 18.3% |
| Japanese | 0.0 /100 | #298 | Tragic 18.3% |
| Ghanaians | 0.0 /100 | #299 | Tragic 18.3% |
| Creek | 0.0 /100 | #300 | Tragic 18.3% |
| Immigrants | Ghana | 0.0 /100 | #301 | Tragic 18.3% |
| Barbadians | 0.0 /100 | #302 | Tragic 18.3% |
| Immigrants | Kenya | 0.0 /100 | #303 | Tragic 18.3% |