Norwegian vs Moroccan Male Unemployment
COMPARE
Norwegian
Moroccan
Male Unemployment
Male Unemployment Comparison
Norwegians
Moroccans
4.4%
MALE UNEMPLOYMENT
100.0/ 100
METRIC RATING
3rd/ 347
METRIC RANK
5.6%
MALE UNEMPLOYMENT
1.6/ 100
METRIC RATING
232nd/ 347
METRIC RANK
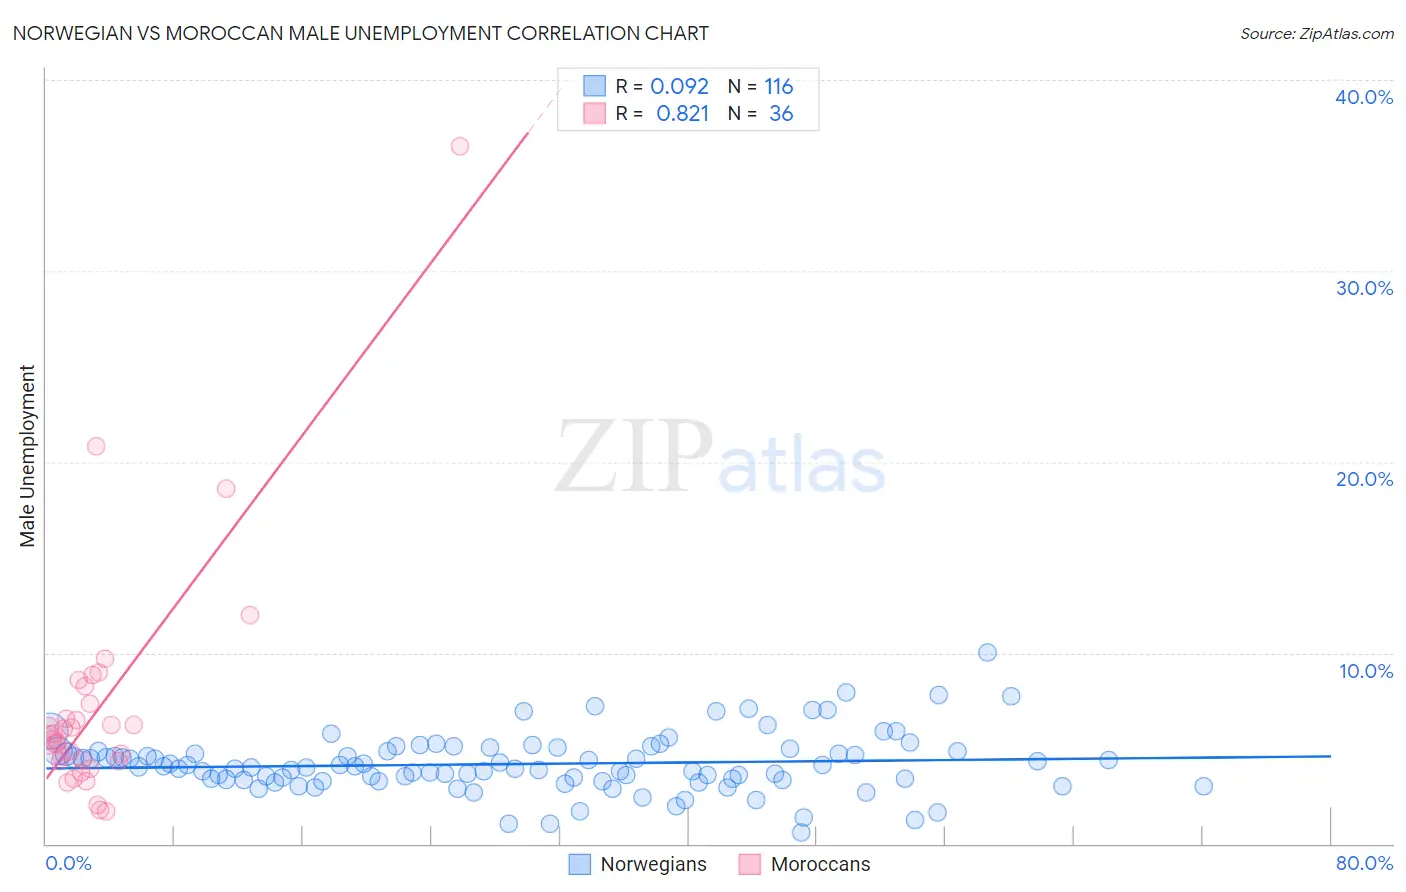
Norwegian vs Moroccan Male Unemployment Correlation Chart
The statistical analysis conducted on geographies consisting of 525,648,173 people shows a slight positive correlation between the proportion of Norwegians and unemployment rate among males in the United States with a correlation coefficient (R) of 0.092 and weighted average of 4.4%. Similarly, the statistical analysis conducted on geographies consisting of 201,559,646 people shows a very strong positive correlation between the proportion of Moroccans and unemployment rate among males in the United States with a correlation coefficient (R) of 0.821 and weighted average of 5.6%, a difference of 26.6%.
Male Unemployment Correlation Summary
| Measurement | Norwegian | Moroccan |
| Minimum | 0.60% | 1.7% |
| Maximum | 10.0% | 36.5% |
| Range | 9.4% | 34.8% |
| Mean | 4.2% | 7.2% |
| Median | 4.0% | 5.6% |
| Interquartile 25% (IQ1) | 3.4% | 4.3% |
| Interquartile 75% (IQ3) | 4.8% | 7.8% |
| Interquartile Range (IQR) | 1.5% | 3.5% |
| Standard Deviation (Sample) | 1.5% | 6.4% |
| Standard Deviation (Population) | 1.5% | 6.3% |
Similar Demographics by Male Unemployment
Demographics Similar to Norwegians by Male Unemployment
In terms of male unemployment, the demographic groups most similar to Norwegians are Immigrants from Cuba (4.4%, a difference of 0.24%), Immigrants from Venezuela (4.4%, a difference of 0.33%), Immigrants from India (4.4%, a difference of 1.3%), Danish (4.5%, a difference of 1.4%), and Venezuelan (4.5%, a difference of 1.8%).
| Demographics | Rating | Rank | Male Unemployment |
| Immigrants | India | 100.0 /100 | #1 | Exceptional 4.4% |
| Immigrants | Cuba | 100.0 /100 | #2 | Exceptional 4.4% |
| Norwegians | 100.0 /100 | #3 | Exceptional 4.4% |
| Immigrants | Venezuela | 100.0 /100 | #4 | Exceptional 4.4% |
| Danes | 100.0 /100 | #5 | Exceptional 4.5% |
| Venezuelans | 100.0 /100 | #6 | Exceptional 4.5% |
| Czechs | 100.0 /100 | #7 | Exceptional 4.5% |
| Luxembourgers | 100.0 /100 | #8 | Exceptional 4.5% |
| Thais | 100.0 /100 | #9 | Exceptional 4.6% |
| Cubans | 100.0 /100 | #10 | Exceptional 4.6% |
| Swedes | 100.0 /100 | #11 | Exceptional 4.6% |
| Immigrants | Bolivia | 100.0 /100 | #12 | Exceptional 4.7% |
| Bolivians | 100.0 /100 | #13 | Exceptional 4.7% |
| Germans | 100.0 /100 | #14 | Exceptional 4.7% |
| Scandinavians | 100.0 /100 | #15 | Exceptional 4.7% |
Demographics Similar to Moroccans by Male Unemployment
In terms of male unemployment, the demographic groups most similar to Moroccans are Choctaw (5.6%, a difference of 0.030%), Somali (5.6%, a difference of 0.080%), Immigrants from Somalia (5.6%, a difference of 0.080%), Immigrants from Africa (5.6%, a difference of 0.090%), and Immigrants from Honduras (5.6%, a difference of 0.11%).
| Demographics | Rating | Rank | Male Unemployment |
| Panamanians | 1.9 /100 | #225 | Tragic 5.6% |
| Immigrants | Cambodia | 1.8 /100 | #226 | Tragic 5.6% |
| Immigrants | Panama | 1.8 /100 | #227 | Tragic 5.6% |
| Seminole | 1.8 /100 | #228 | Tragic 5.6% |
| Central Americans | 1.8 /100 | #229 | Tragic 5.6% |
| Immigrants | Africa | 1.7 /100 | #230 | Tragic 5.6% |
| Choctaw | 1.6 /100 | #231 | Tragic 5.6% |
| Moroccans | 1.6 /100 | #232 | Tragic 5.6% |
| Somalis | 1.5 /100 | #233 | Tragic 5.6% |
| Immigrants | Somalia | 1.5 /100 | #234 | Tragic 5.6% |
| Immigrants | Honduras | 1.5 /100 | #235 | Tragic 5.6% |
| Guatemalans | 1.2 /100 | #236 | Tragic 5.6% |
| Hondurans | 1.1 /100 | #237 | Tragic 5.6% |
| Native Hawaiians | 1.1 /100 | #238 | Tragic 5.6% |
| Immigrants | Guatemala | 1.1 /100 | #239 | Tragic 5.6% |