Norwegian vs Moroccan In Labor Force | Age 20-24
COMPARE
Norwegian
Moroccan
In Labor Force | Age 20-24
In Labor Force | Age 20-24 Comparison
Norwegians
Moroccans
80.1%
IN LABOR FORCE | AGE 20-24
100.0/ 100
METRIC RATING
1st/ 347
METRIC RANK
74.7%
IN LABOR FORCE | AGE 20-24
20.4/ 100
METRIC RATING
202nd/ 347
METRIC RANK
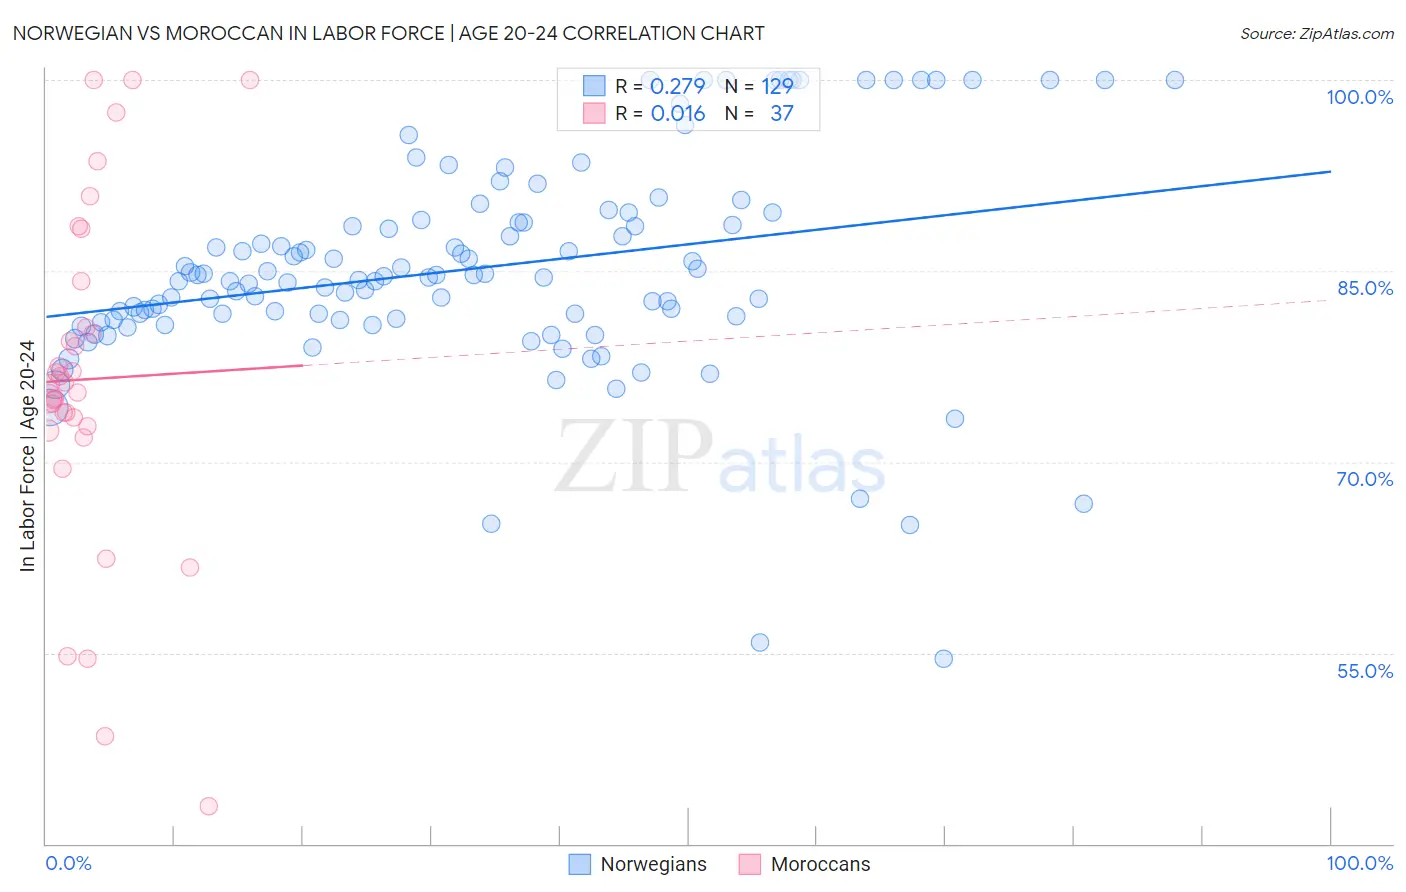
Norwegian vs Moroccan In Labor Force | Age 20-24 Correlation Chart
The statistical analysis conducted on geographies consisting of 532,369,194 people shows a weak positive correlation between the proportion of Norwegians and labor force participation rate among population between the ages 20 and 24 in the United States with a correlation coefficient (R) of 0.279 and weighted average of 80.1%. Similarly, the statistical analysis conducted on geographies consisting of 201,764,515 people shows no correlation between the proportion of Moroccans and labor force participation rate among population between the ages 20 and 24 in the United States with a correlation coefficient (R) of 0.016 and weighted average of 74.7%, a difference of 7.3%.
In Labor Force | Age 20-24 Correlation Summary
| Measurement | Norwegian | Moroccan |
| Minimum | 54.5% | 42.9% |
| Maximum | 100.0% | 100.0% |
| Range | 45.5% | 57.1% |
| Mean | 85.2% | 76.5% |
| Median | 84.5% | 76.1% |
| Interquartile 25% (IQ1) | 81.1% | 72.6% |
| Interquartile 75% (IQ3) | 88.9% | 82.4% |
| Interquartile Range (IQR) | 7.8% | 9.8% |
| Standard Deviation (Sample) | 8.5% | 13.3% |
| Standard Deviation (Population) | 8.5% | 13.2% |
Similar Demographics by In Labor Force | Age 20-24
Demographics Similar to Norwegians by In Labor Force | Age 20-24
In terms of in labor force | age 20-24, the demographic groups most similar to Norwegians are Immigrants from Somalia (79.5%, a difference of 0.76%), Somali (79.3%, a difference of 1.1%), Alaskan Athabascan (79.1%, a difference of 1.3%), Aleut (79.0%, a difference of 1.5%), and Danish (79.0%, a difference of 1.5%).
| Demographics | Rating | Rank | In Labor Force | Age 20-24 |
| Norwegians | 100.0 /100 | #1 | Exceptional 80.1% |
| Immigrants | Somalia | 100.0 /100 | #2 | Exceptional 79.5% |
| Somalis | 100.0 /100 | #3 | Exceptional 79.3% |
| Alaskan Athabascans | 100.0 /100 | #4 | Exceptional 79.1% |
| Aleuts | 100.0 /100 | #5 | Exceptional 79.0% |
| Danes | 100.0 /100 | #6 | Exceptional 79.0% |
| Luxembourgers | 100.0 /100 | #7 | Exceptional 79.0% |
| Immigrants | Cabo Verde | 100.0 /100 | #8 | Exceptional 78.9% |
| Swedes | 100.0 /100 | #9 | Exceptional 78.8% |
| Slovenes | 100.0 /100 | #10 | Exceptional 78.7% |
| Finns | 100.0 /100 | #11 | Exceptional 78.7% |
| Germans | 100.0 /100 | #12 | Exceptional 78.6% |
| Scandinavians | 100.0 /100 | #13 | Exceptional 78.5% |
| Czechs | 100.0 /100 | #14 | Exceptional 78.5% |
| Sudanese | 100.0 /100 | #15 | Exceptional 78.4% |
Demographics Similar to Moroccans by In Labor Force | Age 20-24
In terms of in labor force | age 20-24, the demographic groups most similar to Moroccans are Choctaw (74.7%, a difference of 0.020%), Nigerian (74.7%, a difference of 0.030%), Taiwanese (74.7%, a difference of 0.060%), Immigrants from Northern Africa (74.6%, a difference of 0.060%), and Immigrants from Italy (74.6%, a difference of 0.070%).
| Demographics | Rating | Rank | In Labor Force | Age 20-24 |
| Eastern Europeans | 25.4 /100 | #195 | Fair 74.8% |
| Immigrants | Vietnam | 25.1 /100 | #196 | Fair 74.7% |
| Panamanians | 25.0 /100 | #197 | Fair 74.7% |
| Immigrants | Nigeria | 24.2 /100 | #198 | Fair 74.7% |
| Taiwanese | 23.2 /100 | #199 | Fair 74.7% |
| Nigerians | 21.9 /100 | #200 | Fair 74.7% |
| Choctaw | 21.4 /100 | #201 | Fair 74.7% |
| Moroccans | 20.4 /100 | #202 | Fair 74.7% |
| Immigrants | Northern Africa | 17.9 /100 | #203 | Poor 74.6% |
| Immigrants | Italy | 17.6 /100 | #204 | Poor 74.6% |
| Inupiat | 17.6 /100 | #205 | Poor 74.6% |
| Sioux | 17.5 /100 | #206 | Poor 74.6% |
| Albanians | 16.2 /100 | #207 | Poor 74.6% |
| Immigrants | Uruguay | 15.8 /100 | #208 | Poor 74.6% |
| Arabs | 15.8 /100 | #209 | Poor 74.6% |