Immigrants from Western Africa vs Moroccan Cognitive Disability
COMPARE
Immigrants from Western Africa
Moroccan
Cognitive Disability
Cognitive Disability Comparison
Immigrants from Western Africa
Moroccans
18.4%
COGNITIVE DISABILITY
0.0/ 100
METRIC RATING
308th/ 347
METRIC RANK
17.6%
COGNITIVE DISABILITY
5.9/ 100
METRIC RATING
221st/ 347
METRIC RANK
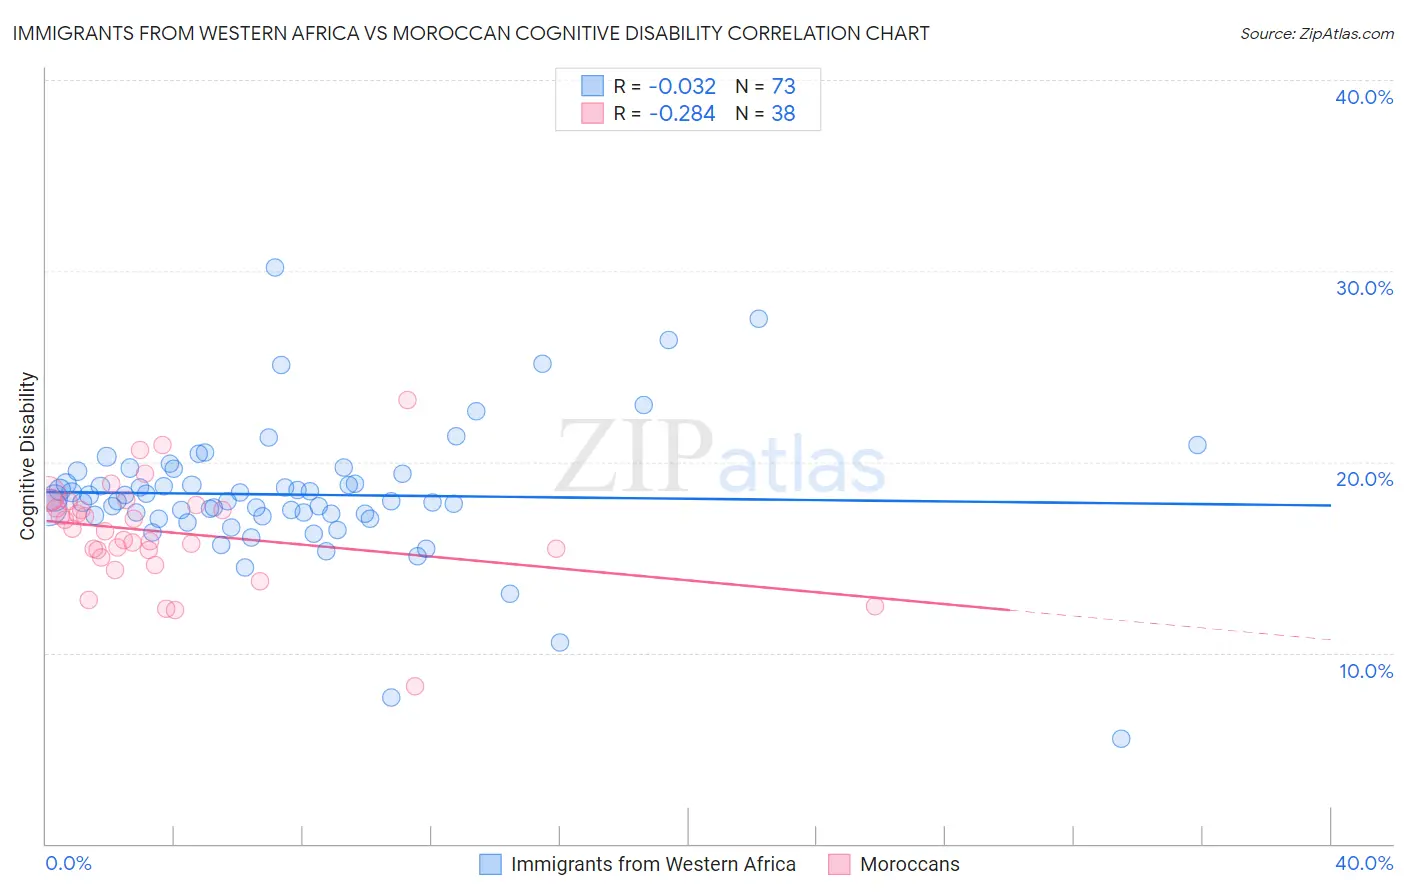
Immigrants from Western Africa vs Moroccan Cognitive Disability Correlation Chart
The statistical analysis conducted on geographies consisting of 357,804,343 people shows no correlation between the proportion of Immigrants from Western Africa and percentage of population with cognitive disability in the United States with a correlation coefficient (R) of -0.032 and weighted average of 18.4%. Similarly, the statistical analysis conducted on geographies consisting of 201,805,523 people shows a weak negative correlation between the proportion of Moroccans and percentage of population with cognitive disability in the United States with a correlation coefficient (R) of -0.284 and weighted average of 17.6%, a difference of 4.2%.
Cognitive Disability Correlation Summary
| Measurement | Immigrants from Western Africa | Moroccan |
| Minimum | 5.5% | 8.3% |
| Maximum | 30.2% | 23.2% |
| Range | 24.6% | 15.0% |
| Mean | 18.3% | 16.3% |
| Median | 17.9% | 16.4% |
| Interquartile 25% (IQ1) | 17.2% | 15.4% |
| Interquartile 75% (IQ3) | 19.5% | 17.7% |
| Interquartile Range (IQR) | 2.3% | 2.3% |
| Standard Deviation (Sample) | 3.6% | 2.7% |
| Standard Deviation (Population) | 3.6% | 2.7% |
Similar Demographics by Cognitive Disability
Demographics Similar to Immigrants from Western Africa by Cognitive Disability
In terms of cognitive disability, the demographic groups most similar to Immigrants from Western Africa are Immigrants from Eastern Africa (18.4%, a difference of 0.040%), Seminole (18.3%, a difference of 0.090%), Ugandan (18.3%, a difference of 0.090%), Colville (18.3%, a difference of 0.10%), and Immigrants from Eritrea (18.3%, a difference of 0.21%).
| Demographics | Rating | Rank | Cognitive Disability |
| Immigrants | Ghana | 0.0 /100 | #301 | Tragic 18.3% |
| Barbadians | 0.0 /100 | #302 | Tragic 18.3% |
| Immigrants | Kenya | 0.0 /100 | #303 | Tragic 18.3% |
| Immigrants | Eritrea | 0.0 /100 | #304 | Tragic 18.3% |
| Colville | 0.0 /100 | #305 | Tragic 18.3% |
| Seminole | 0.0 /100 | #306 | Tragic 18.3% |
| Ugandans | 0.0 /100 | #307 | Tragic 18.3% |
| Immigrants | Western Africa | 0.0 /100 | #308 | Tragic 18.4% |
| Immigrants | Eastern Africa | 0.0 /100 | #309 | Tragic 18.4% |
| Choctaw | 0.0 /100 | #310 | Tragic 18.4% |
| Hmong | 0.0 /100 | #311 | Tragic 18.4% |
| Chickasaw | 0.0 /100 | #312 | Tragic 18.5% |
| Yaqui | 0.0 /100 | #313 | Tragic 18.5% |
| Sub-Saharan Africans | 0.0 /100 | #314 | Tragic 18.5% |
| Immigrants | Dominica | 0.0 /100 | #315 | Tragic 18.6% |
Demographics Similar to Moroccans by Cognitive Disability
In terms of cognitive disability, the demographic groups most similar to Moroccans are Zimbabwean (17.6%, a difference of 0.020%), Icelander (17.6%, a difference of 0.050%), Immigrants from Sierra Leone (17.6%, a difference of 0.050%), Salvadoran (17.6%, a difference of 0.090%), and Okinawan (17.6%, a difference of 0.10%).
| Demographics | Rating | Rank | Cognitive Disability |
| Immigrants | El Salvador | 7.0 /100 | #214 | Tragic 17.6% |
| Alaskan Athabascans | 6.9 /100 | #215 | Tragic 17.6% |
| Okinawans | 6.8 /100 | #216 | Tragic 17.6% |
| Salvadorans | 6.7 /100 | #217 | Tragic 17.6% |
| Icelanders | 6.4 /100 | #218 | Tragic 17.6% |
| Immigrants | Sierra Leone | 6.3 /100 | #219 | Tragic 17.6% |
| Zimbabweans | 6.1 /100 | #220 | Tragic 17.6% |
| Moroccans | 5.9 /100 | #221 | Tragic 17.6% |
| Central Americans | 4.5 /100 | #222 | Tragic 17.7% |
| Alsatians | 4.5 /100 | #223 | Tragic 17.7% |
| Fijians | 3.4 /100 | #224 | Tragic 17.7% |
| Vietnamese | 3.4 /100 | #225 | Tragic 17.7% |
| Marshallese | 2.7 /100 | #226 | Tragic 17.7% |
| Immigrants | St. Vincent and the Grenadines | 2.6 /100 | #227 | Tragic 17.7% |
| Immigrants | Central America | 2.3 /100 | #228 | Tragic 17.7% |