Norwegian vs Immigrants from Morocco Hearing Disability
COMPARE
Norwegian
Immigrants from Morocco
Hearing Disability
Hearing Disability Comparison
Norwegians
Immigrants from Morocco
3.7%
HEARING DISABILITY
0.0/ 100
METRIC RATING
293rd/ 347
METRIC RANK
2.8%
HEARING DISABILITY
96.6/ 100
METRIC RATING
90th/ 347
METRIC RANK
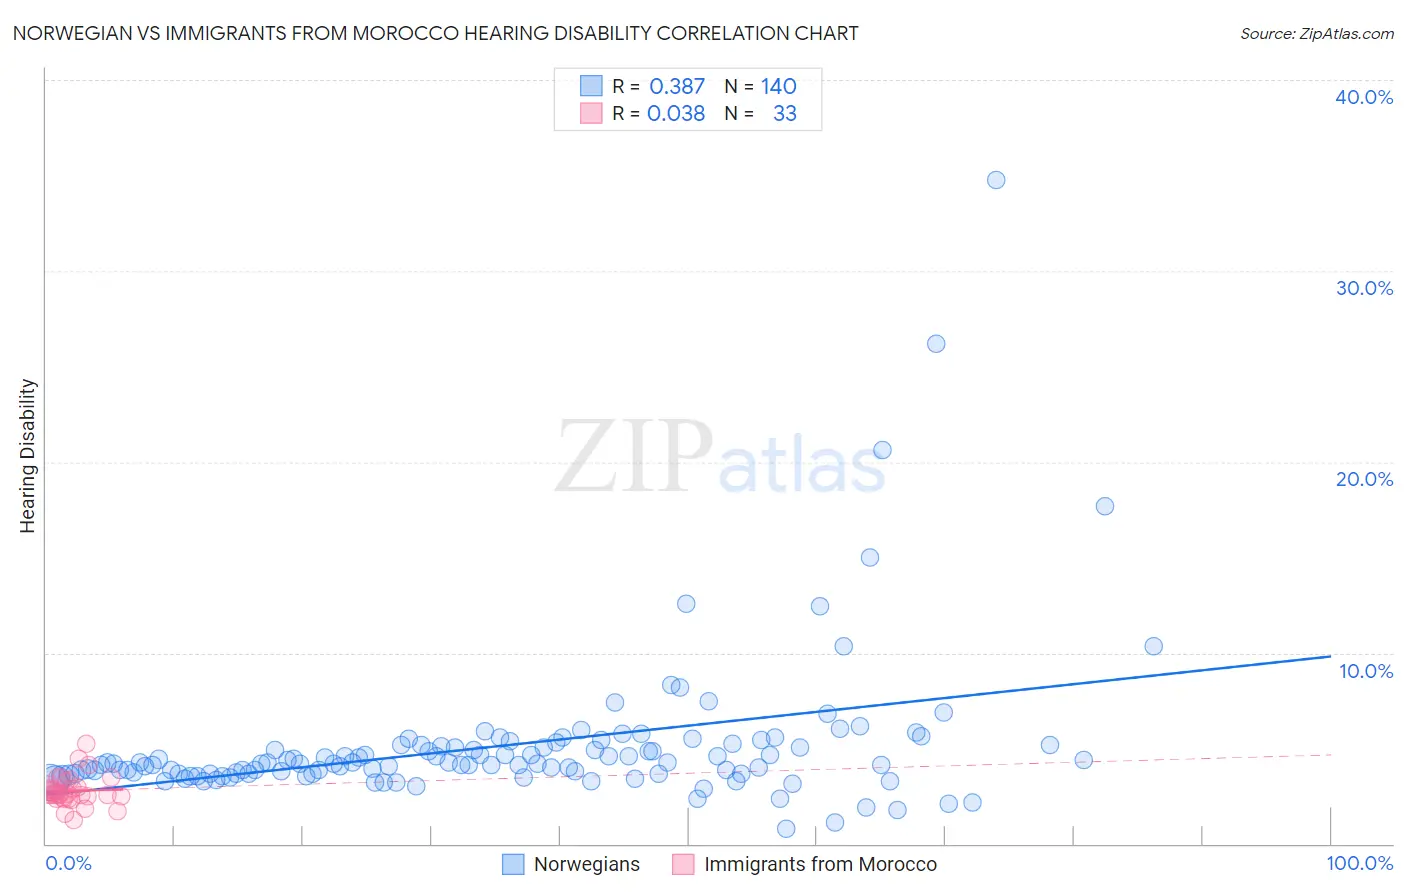
Norwegian vs Immigrants from Morocco Hearing Disability Correlation Chart
The statistical analysis conducted on geographies consisting of 532,928,567 people shows a mild positive correlation between the proportion of Norwegians and percentage of population with hearing disability in the United States with a correlation coefficient (R) of 0.387 and weighted average of 3.7%. Similarly, the statistical analysis conducted on geographies consisting of 178,904,383 people shows no correlation between the proportion of Immigrants from Morocco and percentage of population with hearing disability in the United States with a correlation coefficient (R) of 0.038 and weighted average of 2.8%, a difference of 33.7%.
Hearing Disability Correlation Summary
| Measurement | Norwegian | Immigrants from Morocco |
| Minimum | 0.76% | 1.3% |
| Maximum | 34.8% | 5.2% |
| Range | 34.0% | 4.0% |
| Mean | 5.2% | 2.8% |
| Median | 4.2% | 2.6% |
| Interquartile 25% (IQ1) | 3.7% | 2.4% |
| Interquartile 75% (IQ3) | 5.1% | 3.1% |
| Interquartile Range (IQR) | 1.5% | 0.71% |
| Standard Deviation (Sample) | 4.0% | 0.79% |
| Standard Deviation (Population) | 4.0% | 0.77% |
Similar Demographics by Hearing Disability
Demographics Similar to Norwegians by Hearing Disability
In terms of hearing disability, the demographic groups most similar to Norwegians are Native Hawaiian (3.7%, a difference of 0.060%), Finnish (3.7%, a difference of 0.12%), White/Caucasian (3.7%, a difference of 0.13%), Iroquois (3.7%, a difference of 0.24%), and Chinese (3.7%, a difference of 0.27%).
| Demographics | Rating | Rank | Hearing Disability |
| Delaware | 0.0 /100 | #286 | Tragic 3.6% |
| Spanish | 0.0 /100 | #287 | Tragic 3.7% |
| Irish | 0.0 /100 | #288 | Tragic 3.7% |
| Chinese | 0.0 /100 | #289 | Tragic 3.7% |
| Whites/Caucasians | 0.0 /100 | #290 | Tragic 3.7% |
| Finns | 0.0 /100 | #291 | Tragic 3.7% |
| Native Hawaiians | 0.0 /100 | #292 | Tragic 3.7% |
| Norwegians | 0.0 /100 | #293 | Tragic 3.7% |
| Iroquois | 0.0 /100 | #294 | Tragic 3.7% |
| Welsh | 0.0 /100 | #295 | Tragic 3.7% |
| Pima | 0.0 /100 | #296 | Tragic 3.7% |
| Immigrants | Azores | 0.0 /100 | #297 | Tragic 3.7% |
| Celtics | 0.0 /100 | #298 | Tragic 3.7% |
| Germans | 0.0 /100 | #299 | Tragic 3.7% |
| Scottish | 0.0 /100 | #300 | Tragic 3.7% |
Demographics Similar to Immigrants from Morocco by Hearing Disability
In terms of hearing disability, the demographic groups most similar to Immigrants from Morocco are Belizean (2.8%, a difference of 0.030%), Immigrants from Turkey (2.8%, a difference of 0.050%), Immigrants from Middle Africa (2.8%, a difference of 0.080%), Somali (2.8%, a difference of 0.090%), and Iranian (2.8%, a difference of 0.11%).
| Demographics | Rating | Rank | Hearing Disability |
| Immigrants | Cuba | 97.2 /100 | #83 | Exceptional 2.7% |
| Immigrants | Argentina | 97.0 /100 | #84 | Exceptional 2.8% |
| Immigrants | Northern Africa | 96.9 /100 | #85 | Exceptional 2.8% |
| Immigrants | Iran | 96.8 /100 | #86 | Exceptional 2.8% |
| Somalis | 96.7 /100 | #87 | Exceptional 2.8% |
| Immigrants | Turkey | 96.7 /100 | #88 | Exceptional 2.8% |
| Belizeans | 96.6 /100 | #89 | Exceptional 2.8% |
| Immigrants | Morocco | 96.6 /100 | #90 | Exceptional 2.8% |
| Immigrants | Middle Africa | 96.5 /100 | #91 | Exceptional 2.8% |
| Iranians | 96.4 /100 | #92 | Exceptional 2.8% |
| Immigrants | Kuwait | 96.3 /100 | #93 | Exceptional 2.8% |
| Uruguayans | 95.9 /100 | #94 | Exceptional 2.8% |
| Israelis | 95.9 /100 | #95 | Exceptional 2.8% |
| Immigrants | Somalia | 95.5 /100 | #96 | Exceptional 2.8% |
| Immigrants | Afghanistan | 95.3 /100 | #97 | Exceptional 2.8% |