Norwegian vs Dutch West Indian Hearing Disability
COMPARE
Norwegian
Dutch West Indian
Hearing Disability
Hearing Disability Comparison
Norwegians
Dutch West Indians
3.7%
HEARING DISABILITY
0.0/ 100
METRIC RATING
293rd/ 347
METRIC RANK
4.3%
HEARING DISABILITY
0.0/ 100
METRIC RATING
333rd/ 347
METRIC RANK
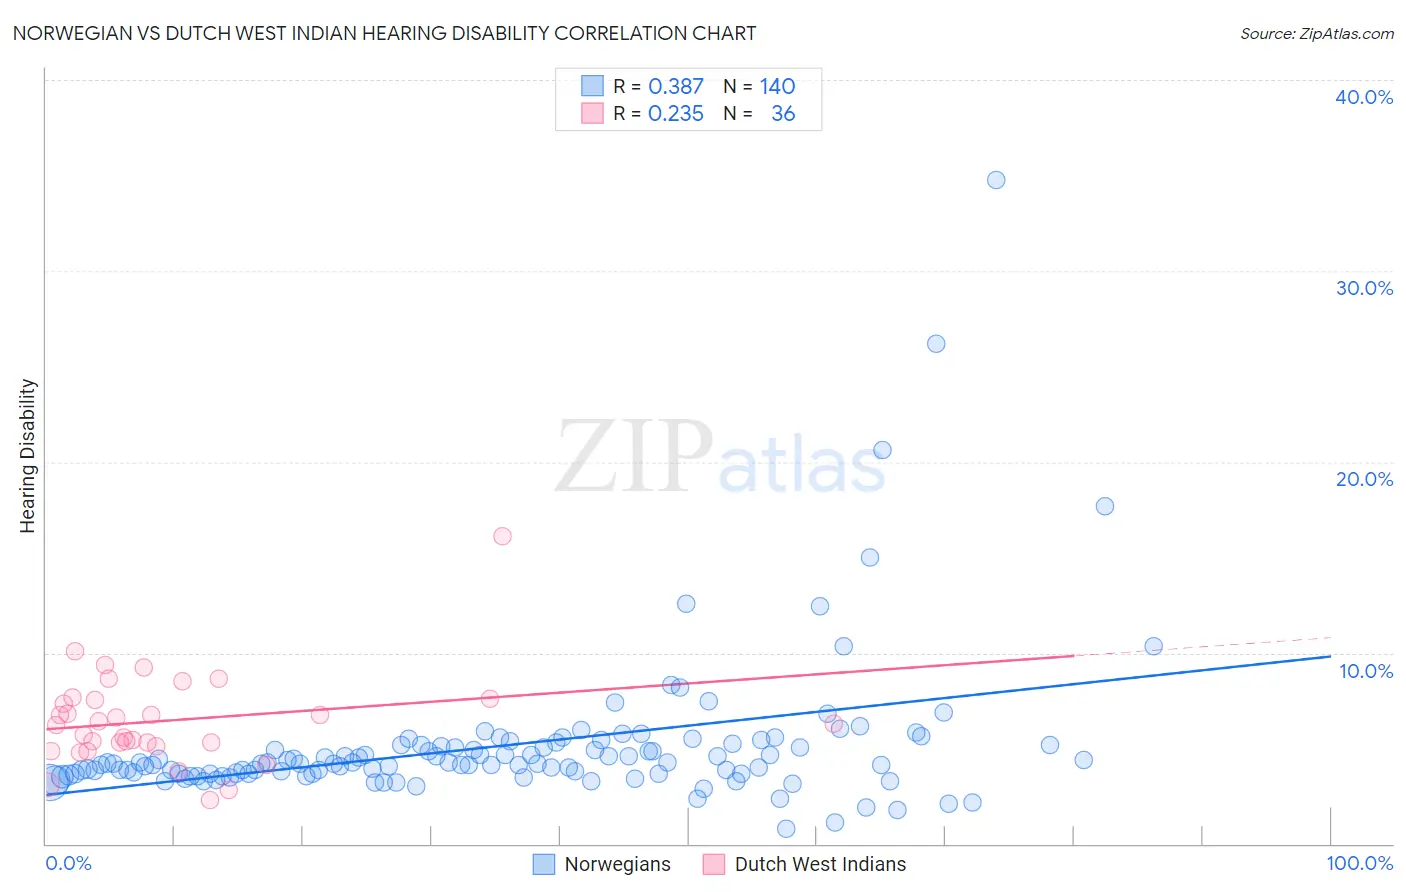
Norwegian vs Dutch West Indian Hearing Disability Correlation Chart
The statistical analysis conducted on geographies consisting of 532,928,567 people shows a mild positive correlation between the proportion of Norwegians and percentage of population with hearing disability in the United States with a correlation coefficient (R) of 0.387 and weighted average of 3.7%. Similarly, the statistical analysis conducted on geographies consisting of 85,766,796 people shows a weak positive correlation between the proportion of Dutch West Indians and percentage of population with hearing disability in the United States with a correlation coefficient (R) of 0.235 and weighted average of 4.3%, a difference of 15.4%.
Hearing Disability Correlation Summary
| Measurement | Norwegian | Dutch West Indian |
| Minimum | 0.76% | 2.3% |
| Maximum | 34.8% | 16.1% |
| Range | 34.0% | 13.9% |
| Mean | 5.2% | 6.5% |
| Median | 4.2% | 6.3% |
| Interquartile 25% (IQ1) | 3.7% | 5.2% |
| Interquartile 75% (IQ3) | 5.1% | 7.6% |
| Interquartile Range (IQR) | 1.5% | 2.4% |
| Standard Deviation (Sample) | 4.0% | 2.5% |
| Standard Deviation (Population) | 4.0% | 2.4% |
Similar Demographics by Hearing Disability
Demographics Similar to Norwegians by Hearing Disability
In terms of hearing disability, the demographic groups most similar to Norwegians are Native Hawaiian (3.7%, a difference of 0.060%), Finnish (3.7%, a difference of 0.12%), White/Caucasian (3.7%, a difference of 0.13%), Iroquois (3.7%, a difference of 0.24%), and Chinese (3.7%, a difference of 0.27%).
| Demographics | Rating | Rank | Hearing Disability |
| Delaware | 0.0 /100 | #286 | Tragic 3.6% |
| Spanish | 0.0 /100 | #287 | Tragic 3.7% |
| Irish | 0.0 /100 | #288 | Tragic 3.7% |
| Chinese | 0.0 /100 | #289 | Tragic 3.7% |
| Whites/Caucasians | 0.0 /100 | #290 | Tragic 3.7% |
| Finns | 0.0 /100 | #291 | Tragic 3.7% |
| Native Hawaiians | 0.0 /100 | #292 | Tragic 3.7% |
| Norwegians | 0.0 /100 | #293 | Tragic 3.7% |
| Iroquois | 0.0 /100 | #294 | Tragic 3.7% |
| Welsh | 0.0 /100 | #295 | Tragic 3.7% |
| Pima | 0.0 /100 | #296 | Tragic 3.7% |
| Immigrants | Azores | 0.0 /100 | #297 | Tragic 3.7% |
| Celtics | 0.0 /100 | #298 | Tragic 3.7% |
| Germans | 0.0 /100 | #299 | Tragic 3.7% |
| Scottish | 0.0 /100 | #300 | Tragic 3.7% |
Demographics Similar to Dutch West Indians by Hearing Disability
In terms of hearing disability, the demographic groups most similar to Dutch West Indians are Aleut (4.3%, a difference of 0.54%), Houma (4.2%, a difference of 0.59%), Cherokee (4.2%, a difference of 1.3%), Native/Alaskan (4.2%, a difference of 1.4%), and Kiowa (4.3%, a difference of 1.9%).
| Demographics | Rating | Rank | Hearing Disability |
| Potawatomi | 0.0 /100 | #326 | Tragic 4.1% |
| Arapaho | 0.0 /100 | #327 | Tragic 4.1% |
| Tohono O'odham | 0.0 /100 | #328 | Tragic 4.2% |
| Crow | 0.0 /100 | #329 | Tragic 4.2% |
| Natives/Alaskans | 0.0 /100 | #330 | Tragic 4.2% |
| Cherokee | 0.0 /100 | #331 | Tragic 4.2% |
| Houma | 0.0 /100 | #332 | Tragic 4.2% |
| Dutch West Indians | 0.0 /100 | #333 | Tragic 4.3% |
| Aleuts | 0.0 /100 | #334 | Tragic 4.3% |
| Kiowa | 0.0 /100 | #335 | Tragic 4.3% |
| Creek | 0.0 /100 | #336 | Tragic 4.4% |
| Chickasaw | 0.0 /100 | #337 | Tragic 4.5% |
| Alaska Natives | 0.0 /100 | #338 | Tragic 4.5% |
| Choctaw | 0.0 /100 | #339 | Tragic 4.5% |
| Pueblo | 0.0 /100 | #340 | Tragic 4.6% |