Norwegian vs Immigrants from Western Africa Hearing Disability
COMPARE
Norwegian
Immigrants from Western Africa
Hearing Disability
Hearing Disability Comparison
Norwegians
Immigrants from Western Africa
3.7%
HEARING DISABILITY
0.0/ 100
METRIC RATING
293rd/ 347
METRIC RANK
2.6%
HEARING DISABILITY
99.6/ 100
METRIC RATING
37th/ 347
METRIC RANK
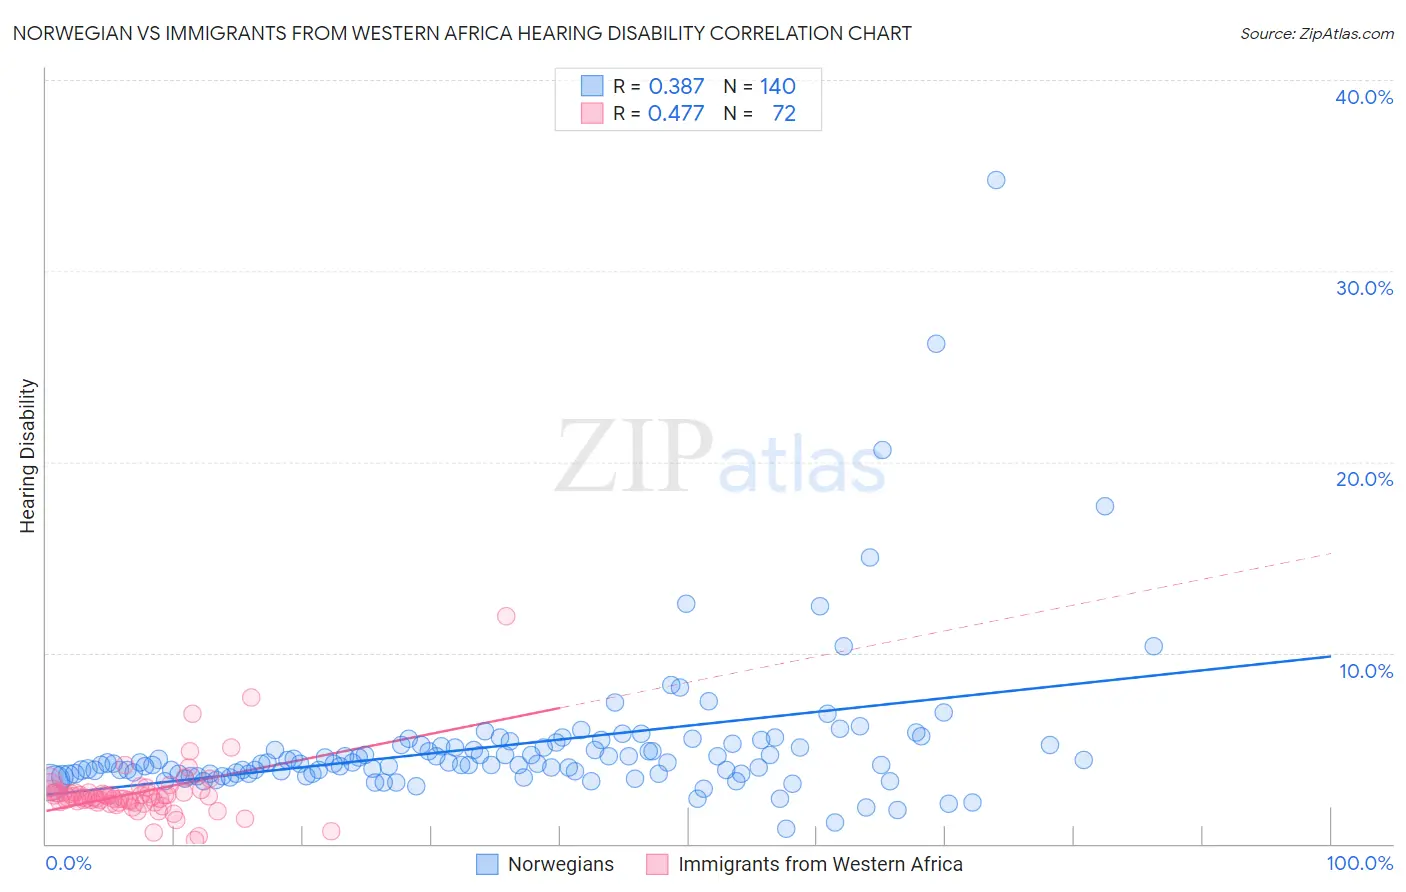
Norwegian vs Immigrants from Western Africa Hearing Disability Correlation Chart
The statistical analysis conducted on geographies consisting of 532,928,567 people shows a mild positive correlation between the proportion of Norwegians and percentage of population with hearing disability in the United States with a correlation coefficient (R) of 0.387 and weighted average of 3.7%. Similarly, the statistical analysis conducted on geographies consisting of 357,657,073 people shows a moderate positive correlation between the proportion of Immigrants from Western Africa and percentage of population with hearing disability in the United States with a correlation coefficient (R) of 0.477 and weighted average of 2.6%, a difference of 41.1%.
Hearing Disability Correlation Summary
| Measurement | Norwegian | Immigrants from Western Africa |
| Minimum | 0.76% | 0.19% |
| Maximum | 34.8% | 11.9% |
| Range | 34.0% | 11.7% |
| Mean | 5.2% | 2.7% |
| Median | 4.2% | 2.4% |
| Interquartile 25% (IQ1) | 3.7% | 2.2% |
| Interquartile 75% (IQ3) | 5.1% | 2.7% |
| Interquartile Range (IQR) | 1.5% | 0.50% |
| Standard Deviation (Sample) | 4.0% | 1.6% |
| Standard Deviation (Population) | 4.0% | 1.6% |
Similar Demographics by Hearing Disability
Demographics Similar to Norwegians by Hearing Disability
In terms of hearing disability, the demographic groups most similar to Norwegians are Native Hawaiian (3.7%, a difference of 0.060%), Finnish (3.7%, a difference of 0.12%), White/Caucasian (3.7%, a difference of 0.13%), Iroquois (3.7%, a difference of 0.24%), and Chinese (3.7%, a difference of 0.27%).
| Demographics | Rating | Rank | Hearing Disability |
| Delaware | 0.0 /100 | #286 | Tragic 3.6% |
| Spanish | 0.0 /100 | #287 | Tragic 3.7% |
| Irish | 0.0 /100 | #288 | Tragic 3.7% |
| Chinese | 0.0 /100 | #289 | Tragic 3.7% |
| Whites/Caucasians | 0.0 /100 | #290 | Tragic 3.7% |
| Finns | 0.0 /100 | #291 | Tragic 3.7% |
| Native Hawaiians | 0.0 /100 | #292 | Tragic 3.7% |
| Norwegians | 0.0 /100 | #293 | Tragic 3.7% |
| Iroquois | 0.0 /100 | #294 | Tragic 3.7% |
| Welsh | 0.0 /100 | #295 | Tragic 3.7% |
| Pima | 0.0 /100 | #296 | Tragic 3.7% |
| Immigrants | Azores | 0.0 /100 | #297 | Tragic 3.7% |
| Celtics | 0.0 /100 | #298 | Tragic 3.7% |
| Germans | 0.0 /100 | #299 | Tragic 3.7% |
| Scottish | 0.0 /100 | #300 | Tragic 3.7% |
Demographics Similar to Immigrants from Western Africa by Hearing Disability
In terms of hearing disability, the demographic groups most similar to Immigrants from Western Africa are Okinawan (2.6%, a difference of 0.020%), Immigrants from Jamaica (2.6%, a difference of 0.080%), Salvadoran (2.6%, a difference of 0.25%), Immigrants from China (2.6%, a difference of 0.32%), and Immigrants from Pakistan (2.6%, a difference of 0.37%).
| Demographics | Rating | Rank | Hearing Disability |
| Immigrants | Caribbean | 99.7 /100 | #30 | Exceptional 2.6% |
| Immigrants | Cameroon | 99.7 /100 | #31 | Exceptional 2.6% |
| Immigrants | Venezuela | 99.7 /100 | #32 | Exceptional 2.6% |
| Filipinos | 99.6 /100 | #33 | Exceptional 2.6% |
| Immigrants | Pakistan | 99.6 /100 | #34 | Exceptional 2.6% |
| Salvadorans | 99.6 /100 | #35 | Exceptional 2.6% |
| Okinawans | 99.6 /100 | #36 | Exceptional 2.6% |
| Immigrants | Western Africa | 99.6 /100 | #37 | Exceptional 2.6% |
| Immigrants | Jamaica | 99.5 /100 | #38 | Exceptional 2.6% |
| Immigrants | China | 99.5 /100 | #39 | Exceptional 2.6% |
| Haitians | 99.5 /100 | #40 | Exceptional 2.6% |
| Immigrants | Taiwan | 99.4 /100 | #41 | Exceptional 2.6% |
| West Indians | 99.4 /100 | #42 | Exceptional 2.6% |
| Senegalese | 99.4 /100 | #43 | Exceptional 2.6% |
| Nigerians | 99.4 /100 | #44 | Exceptional 2.6% |