Norwegian vs Immigrants from Honduras Hearing Disability
COMPARE
Norwegian
Immigrants from Honduras
Hearing Disability
Hearing Disability Comparison
Norwegians
Immigrants from Honduras
3.7%
HEARING DISABILITY
0.0/ 100
METRIC RATING
293rd/ 347
METRIC RANK
2.8%
HEARING DISABILITY
95.1/ 100
METRIC RATING
98th/ 347
METRIC RANK
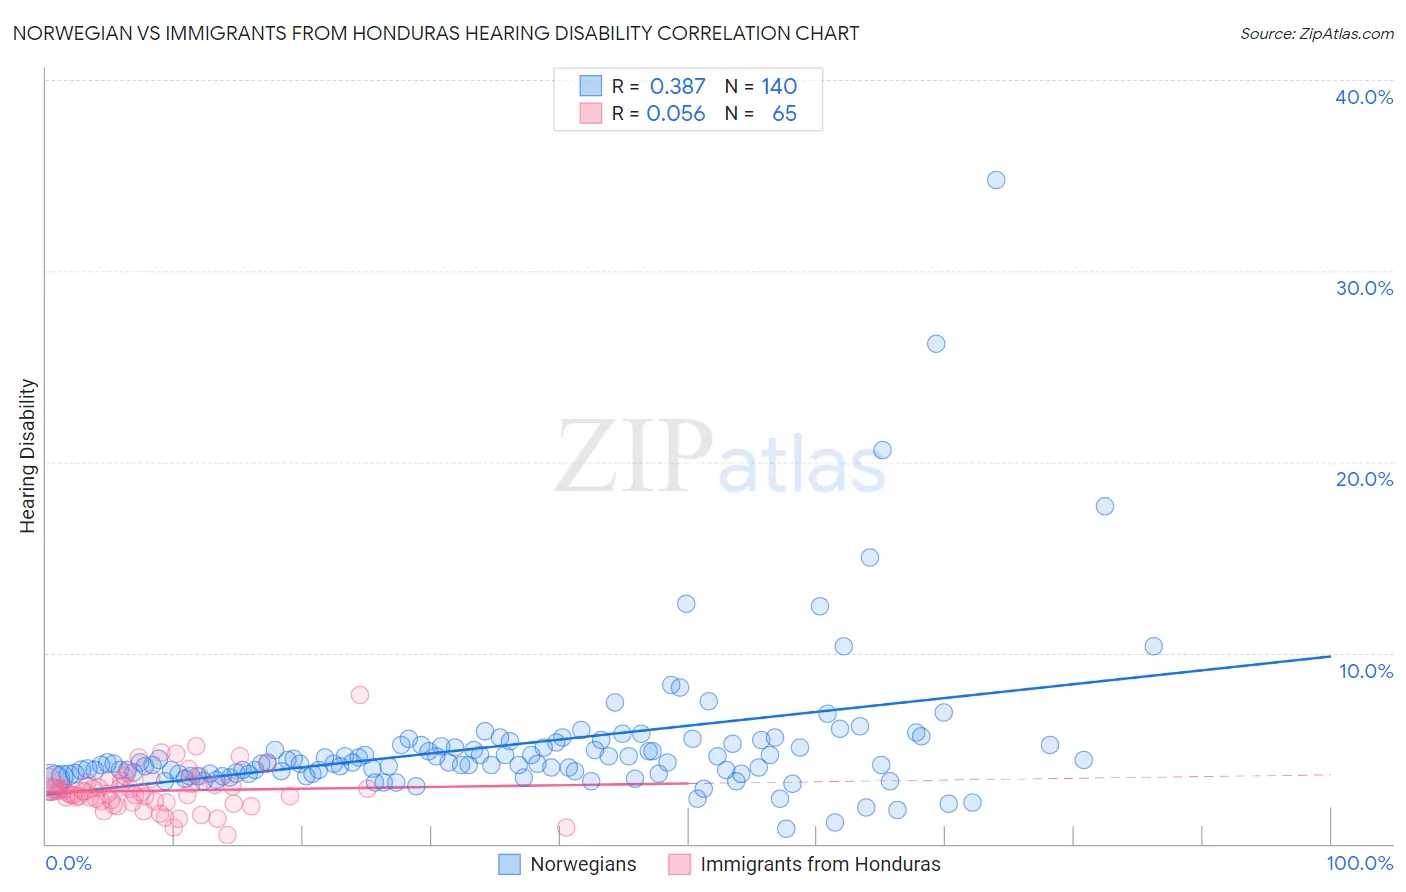
Norwegian vs Immigrants from Honduras Hearing Disability Correlation Chart
The statistical analysis conducted on geographies consisting of 532,928,567 people shows a mild positive correlation between the proportion of Norwegians and percentage of population with hearing disability in the United States with a correlation coefficient (R) of 0.387 and weighted average of 3.7%. Similarly, the statistical analysis conducted on geographies consisting of 322,511,420 people shows a slight positive correlation between the proportion of Immigrants from Honduras and percentage of population with hearing disability in the United States with a correlation coefficient (R) of 0.056 and weighted average of 2.8%, a difference of 32.4%.
Hearing Disability Correlation Summary
| Measurement | Norwegian | Immigrants from Honduras |
| Minimum | 0.76% | 0.44% |
| Maximum | 34.8% | 7.8% |
| Range | 34.0% | 7.3% |
| Mean | 5.2% | 2.8% |
| Median | 4.2% | 2.7% |
| Interquartile 25% (IQ1) | 3.7% | 2.2% |
| Interquartile 75% (IQ3) | 5.1% | 3.2% |
| Interquartile Range (IQR) | 1.5% | 0.98% |
| Standard Deviation (Sample) | 4.0% | 1.1% |
| Standard Deviation (Population) | 4.0% | 1.1% |
Similar Demographics by Hearing Disability
Demographics Similar to Norwegians by Hearing Disability
In terms of hearing disability, the demographic groups most similar to Norwegians are Native Hawaiian (3.7%, a difference of 0.060%), Finnish (3.7%, a difference of 0.12%), White/Caucasian (3.7%, a difference of 0.13%), Iroquois (3.7%, a difference of 0.24%), and Chinese (3.7%, a difference of 0.27%).
| Demographics | Rating | Rank | Hearing Disability |
| Delaware | 0.0 /100 | #286 | Tragic 3.6% |
| Spanish | 0.0 /100 | #287 | Tragic 3.7% |
| Irish | 0.0 /100 | #288 | Tragic 3.7% |
| Chinese | 0.0 /100 | #289 | Tragic 3.7% |
| Whites/Caucasians | 0.0 /100 | #290 | Tragic 3.7% |
| Finns | 0.0 /100 | #291 | Tragic 3.7% |
| Native Hawaiians | 0.0 /100 | #292 | Tragic 3.7% |
| Norwegians | 0.0 /100 | #293 | Tragic 3.7% |
| Iroquois | 0.0 /100 | #294 | Tragic 3.7% |
| Welsh | 0.0 /100 | #295 | Tragic 3.7% |
| Pima | 0.0 /100 | #296 | Tragic 3.7% |
| Immigrants | Azores | 0.0 /100 | #297 | Tragic 3.7% |
| Celtics | 0.0 /100 | #298 | Tragic 3.7% |
| Germans | 0.0 /100 | #299 | Tragic 3.7% |
| Scottish | 0.0 /100 | #300 | Tragic 3.7% |
Demographics Similar to Immigrants from Honduras by Hearing Disability
In terms of hearing disability, the demographic groups most similar to Immigrants from Honduras are Immigrants from Guatemala (2.8%, a difference of 0.040%), Immigrants from Afghanistan (2.8%, a difference of 0.060%), Immigrants from Eastern Africa (2.8%, a difference of 0.090%), Immigrants from Spain (2.8%, a difference of 0.15%), and Taiwanese (2.8%, a difference of 0.16%).
| Demographics | Rating | Rank | Hearing Disability |
| Immigrants | Middle Africa | 96.5 /100 | #91 | Exceptional 2.8% |
| Iranians | 96.4 /100 | #92 | Exceptional 2.8% |
| Immigrants | Kuwait | 96.3 /100 | #93 | Exceptional 2.8% |
| Uruguayans | 95.9 /100 | #94 | Exceptional 2.8% |
| Israelis | 95.9 /100 | #95 | Exceptional 2.8% |
| Immigrants | Somalia | 95.5 /100 | #96 | Exceptional 2.8% |
| Immigrants | Afghanistan | 95.3 /100 | #97 | Exceptional 2.8% |
| Immigrants | Honduras | 95.1 /100 | #98 | Exceptional 2.8% |
| Immigrants | Guatemala | 95.1 /100 | #99 | Exceptional 2.8% |
| Immigrants | Eastern Africa | 95.0 /100 | #100 | Exceptional 2.8% |
| Immigrants | Spain | 94.9 /100 | #101 | Exceptional 2.8% |
| Taiwanese | 94.8 /100 | #102 | Exceptional 2.8% |
| Immigrants | Indonesia | 94.7 /100 | #103 | Exceptional 2.8% |
| Burmese | 94.2 /100 | #104 | Exceptional 2.8% |
| Moroccans | 93.9 /100 | #105 | Exceptional 2.8% |