Northern European vs Canadian Disability Age 65 to 74
COMPARE
Northern European
Canadian
Disability Age 65 to 74
Disability Age 65 to 74 Comparison
Northern Europeans
Canadians
22.6%
DISABILITY AGE 65 TO 74
88.9/ 100
METRIC RATING
133rd/ 347
METRIC RANK
22.9%
DISABILITY AGE 65 TO 74
77.7/ 100
METRIC RATING
150th/ 347
METRIC RANK
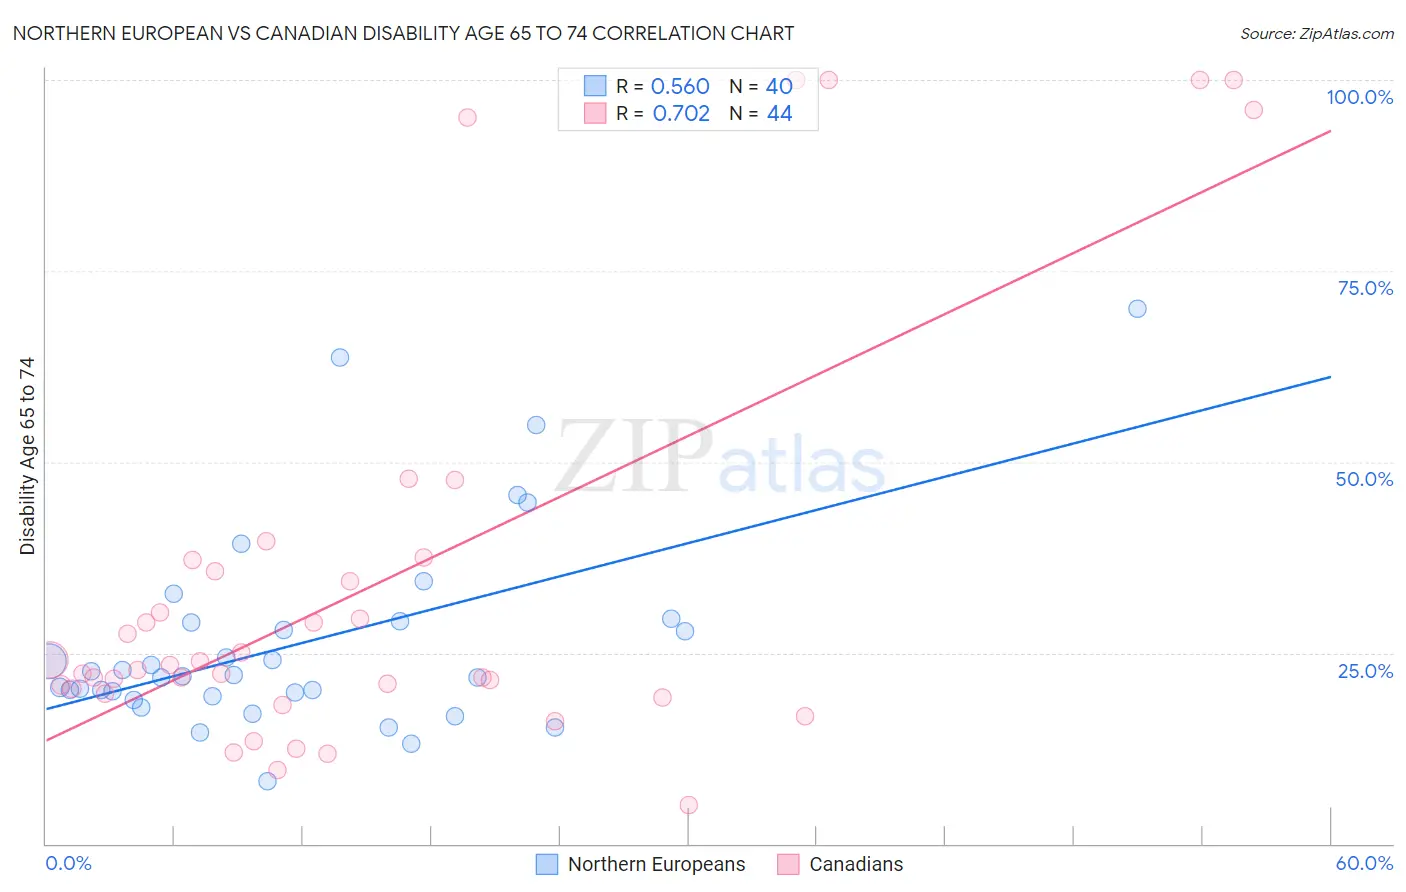
Northern European vs Canadian Disability Age 65 to 74 Correlation Chart
The statistical analysis conducted on geographies consisting of 405,506,893 people shows a substantial positive correlation between the proportion of Northern Europeans and percentage of population with a disability between the ages 65 and 75 in the United States with a correlation coefficient (R) of 0.560 and weighted average of 22.6%. Similarly, the statistical analysis conducted on geographies consisting of 436,683,818 people shows a strong positive correlation between the proportion of Canadians and percentage of population with a disability between the ages 65 and 75 in the United States with a correlation coefficient (R) of 0.702 and weighted average of 22.9%, a difference of 1.3%.
Disability Age 65 to 74 Correlation Summary
| Measurement | Northern European | Canadian |
| Minimum | 8.1% | 5.0% |
| Maximum | 70.0% | 100.0% |
| Range | 61.9% | 95.0% |
| Mean | 26.3% | 34.2% |
| Median | 22.0% | 23.0% |
| Interquartile 25% (IQ1) | 19.6% | 20.0% |
| Interquartile 75% (IQ3) | 29.0% | 36.4% |
| Interquartile Range (IQR) | 9.4% | 16.5% |
| Standard Deviation (Sample) | 13.2% | 27.4% |
| Standard Deviation (Population) | 13.0% | 27.1% |
Demographics Similar to Northern Europeans and Canadians by Disability Age 65 to 74
In terms of disability age 65 to 74, the demographic groups most similar to Northern Europeans are Costa Rican (22.6%, a difference of 0.050%), Afghan (22.6%, a difference of 0.050%), Immigrants from Nepal (22.6%, a difference of 0.080%), Immigrants from Ukraine (22.6%, a difference of 0.080%), and Ethiopian (22.7%, a difference of 0.15%). Similarly, the demographic groups most similar to Canadians are Immigrants from Morocco (22.9%, a difference of 0.0%), Swiss (22.9%, a difference of 0.18%), New Zealander (22.9%, a difference of 0.20%), Immigrants from Uzbekistan (22.8%, a difference of 0.51%), and Alsatian (22.8%, a difference of 0.58%).
| Demographics | Rating | Rank | Disability Age 65 to 74 |
| Immigrants | Nepal | 89.4 /100 | #131 | Excellent 22.6% |
| Costa Ricans | 89.2 /100 | #132 | Excellent 22.6% |
| Northern Europeans | 88.9 /100 | #133 | Excellent 22.6% |
| Afghans | 88.6 /100 | #134 | Excellent 22.6% |
| Immigrants | Ukraine | 88.4 /100 | #135 | Excellent 22.6% |
| Ethiopians | 87.9 /100 | #136 | Excellent 22.7% |
| Taiwanese | 87.6 /100 | #137 | Excellent 22.7% |
| Immigrants | Moldova | 87.3 /100 | #138 | Excellent 22.7% |
| Immigrants | Syria | 85.8 /100 | #139 | Excellent 22.7% |
| Ugandans | 85.4 /100 | #140 | Excellent 22.7% |
| Belgians | 85.3 /100 | #141 | Excellent 22.7% |
| Immigrants | Ethiopia | 85.3 /100 | #142 | Excellent 22.7% |
| Arabs | 84.8 /100 | #143 | Excellent 22.8% |
| Danes | 84.4 /100 | #144 | Excellent 22.8% |
| Immigrants | Uganda | 84.0 /100 | #145 | Excellent 22.8% |
| Alsatians | 83.7 /100 | #146 | Excellent 22.8% |
| Immigrants | Uzbekistan | 83.1 /100 | #147 | Excellent 22.8% |
| New Zealanders | 79.9 /100 | #148 | Good 22.9% |
| Swiss | 79.7 /100 | #149 | Good 22.9% |
| Canadians | 77.7 /100 | #150 | Good 22.9% |
| Immigrants | Morocco | 77.6 /100 | #151 | Good 22.9% |