Nonimmigrants vs Immigrants Hearing Disability
COMPARE
Nonimmigrants
Immigrants
Hearing Disability
Hearing Disability Comparison
Nonimmigrants
Immigrants
3.6%
HEARING DISABILITY
0.0/ 100
METRIC RATING
277th/ 347
METRIC RANK
2.8%
HEARING DISABILITY
90.3/ 100
METRIC RATING
116th/ 347
METRIC RANK
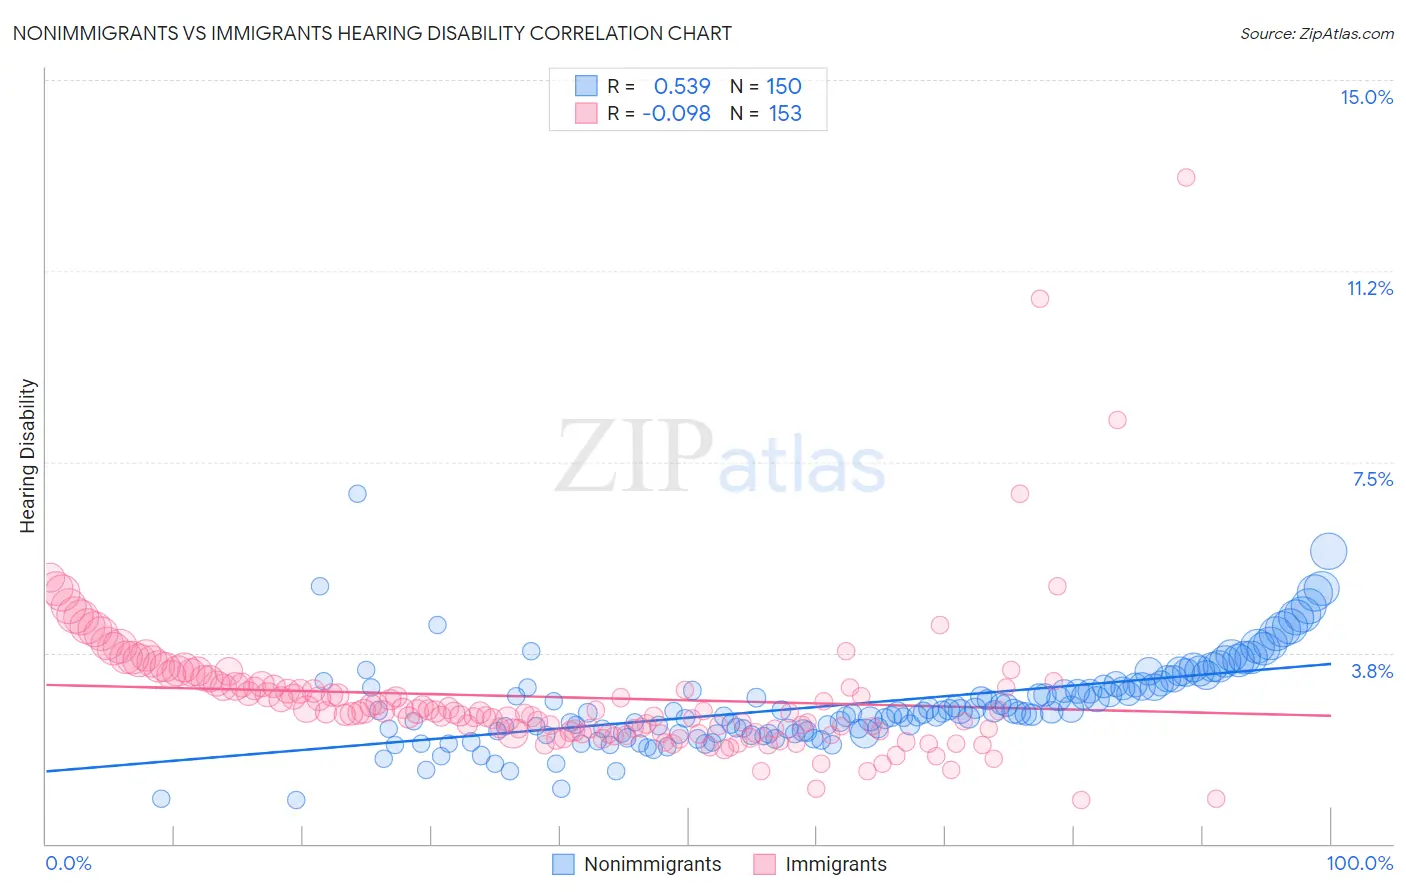
Nonimmigrants vs Immigrants Hearing Disability Correlation Chart
The statistical analysis conducted on geographies consisting of 583,885,168 people shows a substantial positive correlation between the proportion of Nonimmigrants and percentage of population with hearing disability in the United States with a correlation coefficient (R) of 0.539 and weighted average of 3.6%. Similarly, the statistical analysis conducted on geographies consisting of 576,876,891 people shows a slight negative correlation between the proportion of Immigrants and percentage of population with hearing disability in the United States with a correlation coefficient (R) of -0.098 and weighted average of 2.8%, a difference of 26.1%.
Hearing Disability Correlation Summary
| Measurement | Nonimmigrants | Immigrants |
| Minimum | 0.87% | 0.87% |
| Maximum | 6.9% | 13.1% |
| Range | 6.0% | 12.2% |
| Mean | 2.7% | 2.9% |
| Median | 2.6% | 2.6% |
| Interquartile 25% (IQ1) | 2.2% | 2.2% |
| Interquartile 75% (IQ3) | 3.1% | 3.1% |
| Interquartile Range (IQR) | 0.92% | 0.95% |
| Standard Deviation (Sample) | 0.88% | 1.4% |
| Standard Deviation (Population) | 0.88% | 1.4% |
Similar Demographics by Hearing Disability
Demographics Similar to Nonimmigrants by Hearing Disability
In terms of hearing disability, the demographic groups most similar to Nonimmigrants are Basque (3.6%, a difference of 0.39%), Slovak (3.6%, a difference of 0.65%), Danish (3.6%, a difference of 0.70%), French American Indian (3.6%, a difference of 0.72%), and Scandinavian (3.6%, a difference of 0.78%).
| Demographics | Rating | Rank | Hearing Disability |
| Europeans | 0.1 /100 | #270 | Tragic 3.5% |
| Czechs | 0.1 /100 | #271 | Tragic 3.5% |
| Fijians | 0.0 /100 | #272 | Tragic 3.5% |
| Puerto Ricans | 0.0 /100 | #273 | Tragic 3.5% |
| Swiss | 0.0 /100 | #274 | Tragic 3.5% |
| Czechoslovakians | 0.0 /100 | #275 | Tragic 3.6% |
| Danes | 0.0 /100 | #276 | Tragic 3.6% |
| Immigrants | Nonimmigrants | 0.0 /100 | #277 | Tragic 3.6% |
| Basques | 0.0 /100 | #278 | Tragic 3.6% |
| Slovaks | 0.0 /100 | #279 | Tragic 3.6% |
| French American Indians | 0.0 /100 | #280 | Tragic 3.6% |
| Scandinavians | 0.0 /100 | #281 | Tragic 3.6% |
| Swedes | 0.0 /100 | #282 | Tragic 3.6% |
| Blackfeet | 0.0 /100 | #283 | Tragic 3.6% |
| Immigrants | Micronesia | 0.0 /100 | #284 | Tragic 3.6% |
Demographics Similar to Immigrants by Hearing Disability
In terms of hearing disability, the demographic groups most similar to Immigrants are Immigrants from Latin America (2.8%, a difference of 0.060%), Immigrants from Liberia (2.8%, a difference of 0.090%), Zimbabwean (2.8%, a difference of 0.10%), Kenyan (2.8%, a difference of 0.12%), and Jordanian (2.8%, a difference of 0.21%).
| Demographics | Rating | Rank | Hearing Disability |
| Turks | 93.0 /100 | #109 | Exceptional 2.8% |
| Cypriots | 92.9 /100 | #110 | Exceptional 2.8% |
| Immigrants | Yemen | 92.7 /100 | #111 | Exceptional 2.8% |
| U.S. Virgin Islanders | 92.5 /100 | #112 | Exceptional 2.8% |
| Immigrants | Belarus | 91.6 /100 | #113 | Exceptional 2.8% |
| Cambodians | 91.1 /100 | #114 | Exceptional 2.8% |
| Immigrants | Latin America | 90.5 /100 | #115 | Exceptional 2.8% |
| Immigrants | Immigrants | 90.3 /100 | #116 | Exceptional 2.8% |
| Immigrants | Liberia | 90.0 /100 | #117 | Excellent 2.8% |
| Zimbabweans | 89.9 /100 | #118 | Excellent 2.8% |
| Kenyans | 89.8 /100 | #119 | Excellent 2.8% |
| Jordanians | 89.5 /100 | #120 | Excellent 2.8% |
| Cubans | 89.4 /100 | #121 | Excellent 2.8% |
| Liberians | 89.0 /100 | #122 | Excellent 2.8% |
| Immigrants | Zaire | 88.6 /100 | #123 | Excellent 2.9% |