Immigrants from Sudan vs Filipino Female Disability
COMPARE
Immigrants from Sudan
Filipino
Female Disability
Female Disability Comparison
Immigrants from Sudan
Filipinos
11.9%
FEMALE DISABILITY
89.6/ 100
METRIC RATING
143rd/ 347
METRIC RANK
10.1%
FEMALE DISABILITY
100.0/ 100
METRIC RATING
2nd/ 347
METRIC RANK
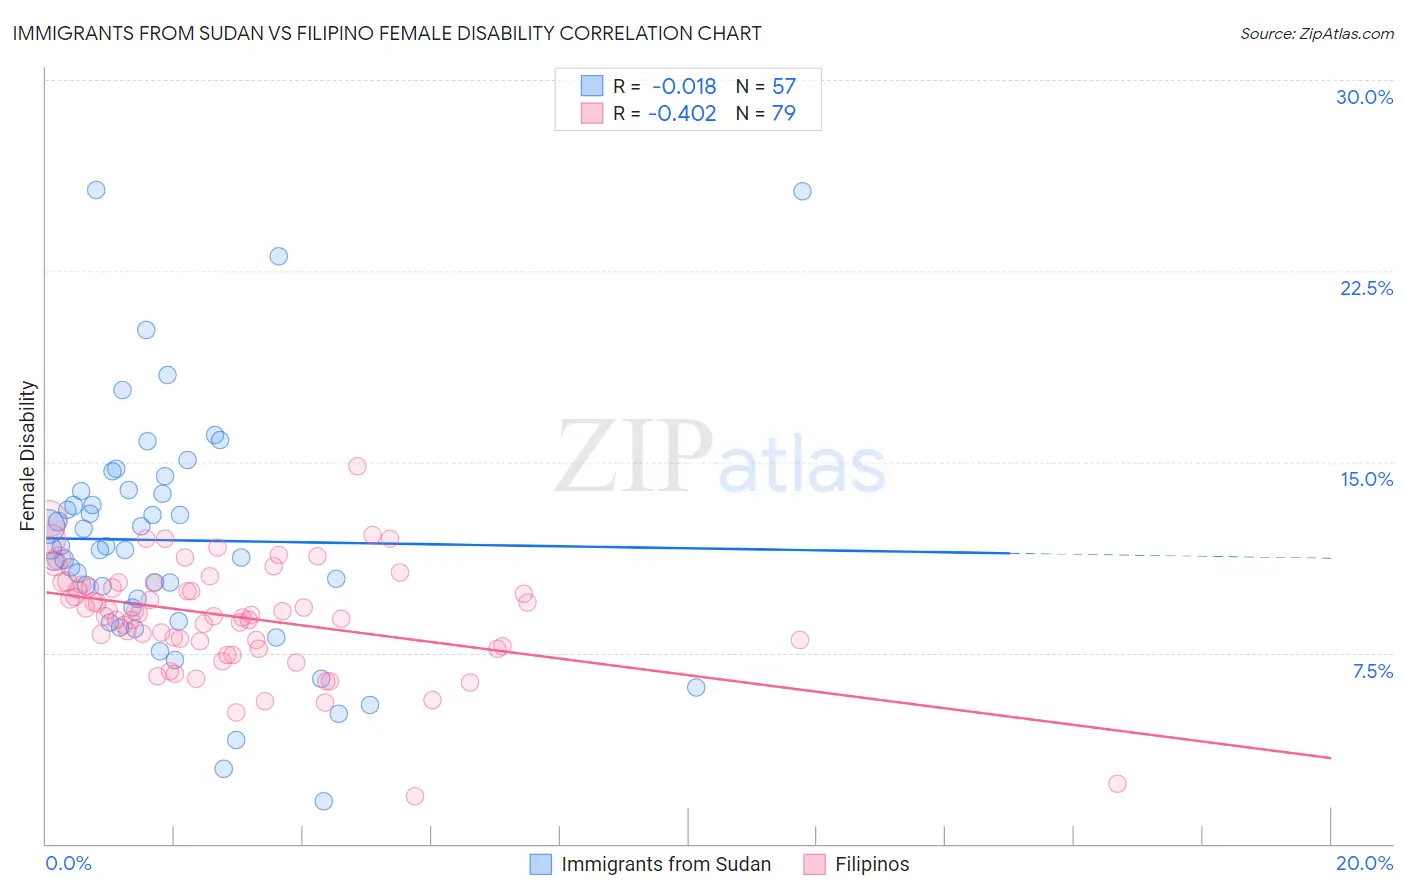
Immigrants from Sudan vs Filipino Female Disability Correlation Chart
The statistical analysis conducted on geographies consisting of 118,956,198 people shows no correlation between the proportion of Immigrants from Sudan and percentage of females with a disability in the United States with a correlation coefficient (R) of -0.018 and weighted average of 11.9%. Similarly, the statistical analysis conducted on geographies consisting of 254,340,096 people shows a moderate negative correlation between the proportion of Filipinos and percentage of females with a disability in the United States with a correlation coefficient (R) of -0.402 and weighted average of 10.1%, a difference of 18.7%.
Female Disability Correlation Summary
| Measurement | Immigrants from Sudan | Filipino |
| Minimum | 1.7% | 1.9% |
| Maximum | 25.7% | 14.8% |
| Range | 24.0% | 13.0% |
| Mean | 11.9% | 8.9% |
| Median | 11.6% | 9.0% |
| Interquartile 25% (IQ1) | 9.0% | 7.8% |
| Interquartile 75% (IQ3) | 13.9% | 10.3% |
| Interquartile Range (IQR) | 4.9% | 2.5% |
| Standard Deviation (Sample) | 4.8% | 2.2% |
| Standard Deviation (Population) | 4.7% | 2.1% |
Similar Demographics by Female Disability
Demographics Similar to Immigrants from Sudan by Female Disability
In terms of female disability, the demographic groups most similar to Immigrants from Sudan are Immigrants from Africa (11.9%, a difference of 0.040%), Immigrants from Austria (12.0%, a difference of 0.17%), Estonian (12.0%, a difference of 0.17%), Immigrants from Ecuador (11.9%, a difference of 0.21%), and Romanian (11.9%, a difference of 0.23%).
| Demographics | Rating | Rank | Female Disability |
| Ugandans | 94.0 /100 | #136 | Exceptional 11.9% |
| Immigrants | Norway | 93.8 /100 | #137 | Exceptional 11.9% |
| Ecuadorians | 93.4 /100 | #138 | Exceptional 11.9% |
| Immigrants | Hungary | 92.8 /100 | #139 | Exceptional 11.9% |
| Romanians | 91.6 /100 | #140 | Exceptional 11.9% |
| Immigrants | Ecuador | 91.5 /100 | #141 | Exceptional 11.9% |
| Immigrants | Africa | 90.0 /100 | #142 | Excellent 11.9% |
| Immigrants | Sudan | 89.6 /100 | #143 | Excellent 11.9% |
| Immigrants | Austria | 87.9 /100 | #144 | Excellent 12.0% |
| Estonians | 87.8 /100 | #145 | Excellent 12.0% |
| Pakistanis | 84.6 /100 | #146 | Excellent 12.0% |
| Nigerians | 84.0 /100 | #147 | Excellent 12.0% |
| Immigrants | Kenya | 83.1 /100 | #148 | Excellent 12.0% |
| Greeks | 82.0 /100 | #149 | Excellent 12.0% |
| Immigrants | Moldova | 81.4 /100 | #150 | Excellent 12.0% |
Demographics Similar to Filipinos by Female Disability
In terms of female disability, the demographic groups most similar to Filipinos are Immigrants from Taiwan (10.1%, a difference of 0.23%), Immigrants from India (10.0%, a difference of 0.93%), Thai (10.2%, a difference of 1.1%), Immigrants from Bolivia (10.3%, a difference of 1.9%), and Bolivian (10.4%, a difference of 2.9%).
| Demographics | Rating | Rank | Female Disability |
| Immigrants | India | 100.0 /100 | #1 | Exceptional 10.0% |
| Filipinos | 100.0 /100 | #2 | Exceptional 10.1% |
| Immigrants | Taiwan | 100.0 /100 | #3 | Exceptional 10.1% |
| Thais | 100.0 /100 | #4 | Exceptional 10.2% |
| Immigrants | Bolivia | 100.0 /100 | #5 | Exceptional 10.3% |
| Bolivians | 100.0 /100 | #6 | Exceptional 10.4% |
| Immigrants | Singapore | 100.0 /100 | #7 | Exceptional 10.4% |
| Immigrants | South Central Asia | 100.0 /100 | #8 | Exceptional 10.5% |
| Iranians | 100.0 /100 | #9 | Exceptional 10.6% |
| Immigrants | Hong Kong | 100.0 /100 | #10 | Exceptional 10.6% |
| Immigrants | Korea | 100.0 /100 | #11 | Exceptional 10.6% |
| Immigrants | Israel | 100.0 /100 | #12 | Exceptional 10.7% |
| Immigrants | Eastern Asia | 100.0 /100 | #13 | Exceptional 10.7% |
| Immigrants | China | 100.0 /100 | #14 | Exceptional 10.7% |
| Burmese | 100.0 /100 | #15 | Exceptional 10.7% |