English vs Immigrants from Dominica Cognitive Disability
COMPARE
English
Immigrants from Dominica
Cognitive Disability
Cognitive Disability Comparison
English
Immigrants from Dominica
16.8%
COGNITIVE DISABILITY
98.6/ 100
METRIC RATING
95th/ 347
METRIC RANK
18.6%
COGNITIVE DISABILITY
0.0/ 100
METRIC RATING
315th/ 347
METRIC RANK
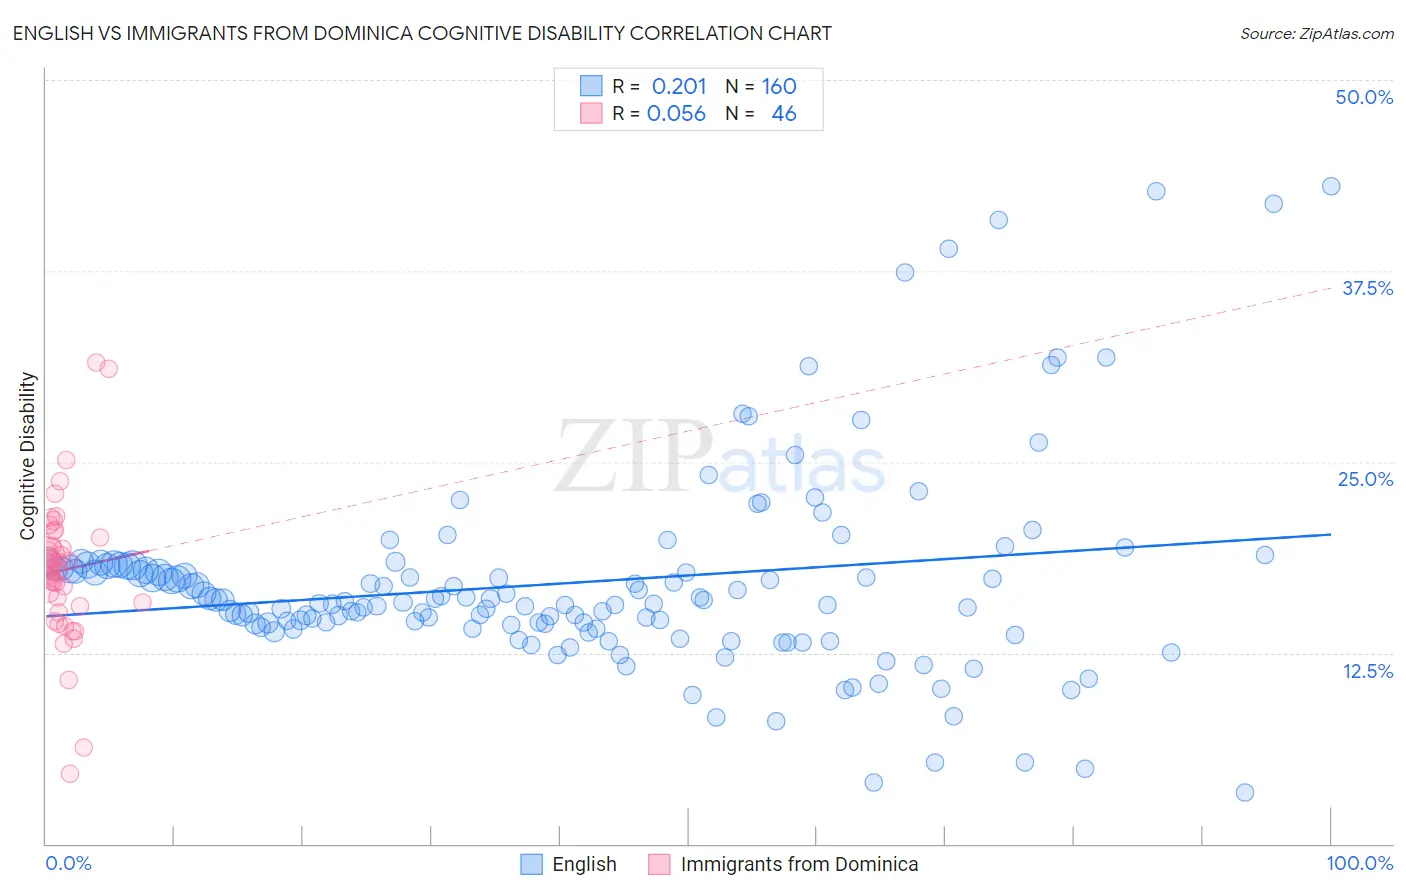
English vs Immigrants from Dominica Cognitive Disability Correlation Chart
The statistical analysis conducted on geographies consisting of 579,706,008 people shows a weak positive correlation between the proportion of English and percentage of population with cognitive disability in the United States with a correlation coefficient (R) of 0.201 and weighted average of 16.8%. Similarly, the statistical analysis conducted on geographies consisting of 83,793,635 people shows a slight positive correlation between the proportion of Immigrants from Dominica and percentage of population with cognitive disability in the United States with a correlation coefficient (R) of 0.056 and weighted average of 18.6%, a difference of 10.7%.
Cognitive Disability Correlation Summary
| Measurement | English | Immigrants from Dominica |
| Minimum | 3.4% | 4.6% |
| Maximum | 43.0% | 31.5% |
| Range | 39.7% | 27.0% |
| Mean | 17.1% | 17.9% |
| Median | 15.8% | 18.0% |
| Interquartile 25% (IQ1) | 14.3% | 15.6% |
| Interquartile 75% (IQ3) | 18.1% | 20.0% |
| Interquartile Range (IQR) | 3.8% | 4.5% |
| Standard Deviation (Sample) | 6.6% | 4.8% |
| Standard Deviation (Population) | 6.6% | 4.8% |
Similar Demographics by Cognitive Disability
Demographics Similar to English by Cognitive Disability
In terms of cognitive disability, the demographic groups most similar to English are Finnish (16.8%, a difference of 0.020%), Dutch (16.8%, a difference of 0.040%), Asian (16.7%, a difference of 0.060%), Immigrants from Lebanon (16.8%, a difference of 0.060%), and Immigrants from South America (16.7%, a difference of 0.11%).
| Demographics | Rating | Rank | Cognitive Disability |
| Immigrants | Philippines | 99.0 /100 | #88 | Exceptional 16.7% |
| Immigrants | Egypt | 98.8 /100 | #89 | Exceptional 16.7% |
| South Americans | 98.8 /100 | #90 | Exceptional 16.7% |
| Danes | 98.8 /100 | #91 | Exceptional 16.7% |
| Immigrants | South America | 98.8 /100 | #92 | Exceptional 16.7% |
| Immigrants | Southern Europe | 98.7 /100 | #93 | Exceptional 16.7% |
| Asians | 98.7 /100 | #94 | Exceptional 16.7% |
| English | 98.6 /100 | #95 | Exceptional 16.8% |
| Finns | 98.5 /100 | #96 | Exceptional 16.8% |
| Dutch | 98.5 /100 | #97 | Exceptional 16.8% |
| Immigrants | Lebanon | 98.4 /100 | #98 | Exceptional 16.8% |
| Jordanians | 98.2 /100 | #99 | Exceptional 16.8% |
| Immigrants | Russia | 98.2 /100 | #100 | Exceptional 16.8% |
| Immigrants | Asia | 98.1 /100 | #101 | Exceptional 16.8% |
| Irish | 98.1 /100 | #102 | Exceptional 16.8% |
Demographics Similar to Immigrants from Dominica by Cognitive Disability
In terms of cognitive disability, the demographic groups most similar to Immigrants from Dominica are Immigrants from Middle Africa (18.6%, a difference of 0.080%), Liberian (18.6%, a difference of 0.16%), Subsaharan African (18.5%, a difference of 0.18%), Yaqui (18.5%, a difference of 0.24%), and Bangladeshi (18.6%, a difference of 0.28%).
| Demographics | Rating | Rank | Cognitive Disability |
| Immigrants | Western Africa | 0.0 /100 | #308 | Tragic 18.4% |
| Immigrants | Eastern Africa | 0.0 /100 | #309 | Tragic 18.4% |
| Choctaw | 0.0 /100 | #310 | Tragic 18.4% |
| Hmong | 0.0 /100 | #311 | Tragic 18.4% |
| Chickasaw | 0.0 /100 | #312 | Tragic 18.5% |
| Yaqui | 0.0 /100 | #313 | Tragic 18.5% |
| Sub-Saharan Africans | 0.0 /100 | #314 | Tragic 18.5% |
| Immigrants | Dominica | 0.0 /100 | #315 | Tragic 18.6% |
| Immigrants | Middle Africa | 0.0 /100 | #316 | Tragic 18.6% |
| Liberians | 0.0 /100 | #317 | Tragic 18.6% |
| Bangladeshis | 0.0 /100 | #318 | Tragic 18.6% |
| Comanche | 0.0 /100 | #319 | Tragic 18.6% |
| Apache | 0.0 /100 | #320 | Tragic 18.6% |
| Africans | 0.0 /100 | #321 | Tragic 18.6% |
| Immigrants | Liberia | 0.0 /100 | #322 | Tragic 18.7% |