Immigrants from Bangladesh vs Immigrants from Dominica Cognitive Disability
COMPARE
Immigrants from Bangladesh
Immigrants from Dominica
Cognitive Disability
Cognitive Disability Comparison
Immigrants from Bangladesh
Immigrants from Dominica
17.8%
COGNITIVE DISABILITY
1.0/ 100
METRIC RATING
243rd/ 347
METRIC RANK
18.6%
COGNITIVE DISABILITY
0.0/ 100
METRIC RATING
315th/ 347
METRIC RANK
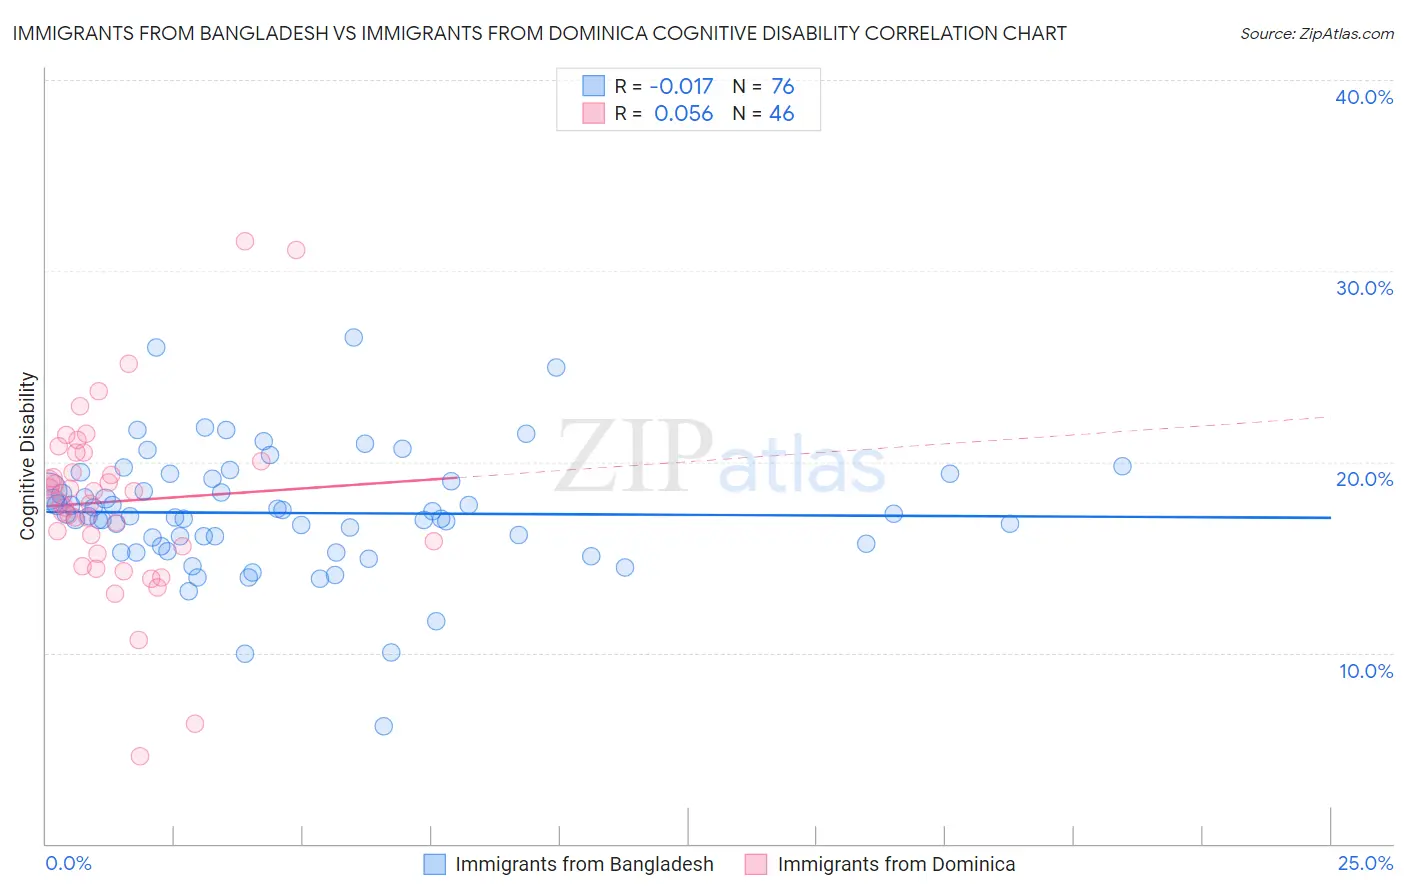
Immigrants from Bangladesh vs Immigrants from Dominica Cognitive Disability Correlation Chart
The statistical analysis conducted on geographies consisting of 203,670,223 people shows no correlation between the proportion of Immigrants from Bangladesh and percentage of population with cognitive disability in the United States with a correlation coefficient (R) of -0.017 and weighted average of 17.8%. Similarly, the statistical analysis conducted on geographies consisting of 83,793,635 people shows a slight positive correlation between the proportion of Immigrants from Dominica and percentage of population with cognitive disability in the United States with a correlation coefficient (R) of 0.056 and weighted average of 18.6%, a difference of 4.0%.
Cognitive Disability Correlation Summary
| Measurement | Immigrants from Bangladesh | Immigrants from Dominica |
| Minimum | 6.2% | 4.6% |
| Maximum | 26.5% | 31.5% |
| Range | 20.3% | 27.0% |
| Mean | 17.3% | 17.9% |
| Median | 17.2% | 18.0% |
| Interquartile 25% (IQ1) | 15.6% | 15.6% |
| Interquartile 75% (IQ3) | 19.1% | 20.0% |
| Interquartile Range (IQR) | 3.4% | 4.5% |
| Standard Deviation (Sample) | 3.2% | 4.8% |
| Standard Deviation (Population) | 3.2% | 4.8% |
Similar Demographics by Cognitive Disability
Demographics Similar to Immigrants from Bangladesh by Cognitive Disability
In terms of cognitive disability, the demographic groups most similar to Immigrants from Bangladesh are Jamaican (17.9%, a difference of 0.040%), Paiute (17.8%, a difference of 0.070%), Mexican (17.8%, a difference of 0.090%), Trinidadian and Tobagonian (17.9%, a difference of 0.13%), and Immigrants from Thailand (17.9%, a difference of 0.15%).
| Demographics | Rating | Rank | Cognitive Disability |
| Immigrants | Iraq | 1.8 /100 | #236 | Tragic 17.8% |
| Immigrants | Mexico | 1.8 /100 | #237 | Tragic 17.8% |
| Cheyenne | 1.7 /100 | #238 | Tragic 17.8% |
| Cajuns | 1.4 /100 | #239 | Tragic 17.8% |
| Iraqis | 1.4 /100 | #240 | Tragic 17.8% |
| Mexicans | 1.1 /100 | #241 | Tragic 17.8% |
| Paiute | 1.1 /100 | #242 | Tragic 17.8% |
| Immigrants | Bangladesh | 1.0 /100 | #243 | Tragic 17.8% |
| Jamaicans | 0.9 /100 | #244 | Tragic 17.9% |
| Trinidadians and Tobagonians | 0.8 /100 | #245 | Tragic 17.9% |
| Immigrants | Thailand | 0.8 /100 | #246 | Tragic 17.9% |
| Samoans | 0.7 /100 | #247 | Tragic 17.9% |
| French American Indians | 0.7 /100 | #248 | Tragic 17.9% |
| Cree | 0.7 /100 | #249 | Tragic 17.9% |
| Immigrants | Ethiopia | 0.7 /100 | #250 | Tragic 17.9% |
Demographics Similar to Immigrants from Dominica by Cognitive Disability
In terms of cognitive disability, the demographic groups most similar to Immigrants from Dominica are Immigrants from Middle Africa (18.6%, a difference of 0.080%), Liberian (18.6%, a difference of 0.16%), Subsaharan African (18.5%, a difference of 0.18%), Yaqui (18.5%, a difference of 0.24%), and Bangladeshi (18.6%, a difference of 0.28%).
| Demographics | Rating | Rank | Cognitive Disability |
| Immigrants | Western Africa | 0.0 /100 | #308 | Tragic 18.4% |
| Immigrants | Eastern Africa | 0.0 /100 | #309 | Tragic 18.4% |
| Choctaw | 0.0 /100 | #310 | Tragic 18.4% |
| Hmong | 0.0 /100 | #311 | Tragic 18.4% |
| Chickasaw | 0.0 /100 | #312 | Tragic 18.5% |
| Yaqui | 0.0 /100 | #313 | Tragic 18.5% |
| Sub-Saharan Africans | 0.0 /100 | #314 | Tragic 18.5% |
| Immigrants | Dominica | 0.0 /100 | #315 | Tragic 18.6% |
| Immigrants | Middle Africa | 0.0 /100 | #316 | Tragic 18.6% |
| Liberians | 0.0 /100 | #317 | Tragic 18.6% |
| Bangladeshis | 0.0 /100 | #318 | Tragic 18.6% |
| Comanche | 0.0 /100 | #319 | Tragic 18.6% |
| Apache | 0.0 /100 | #320 | Tragic 18.6% |
| Africans | 0.0 /100 | #321 | Tragic 18.6% |
| Immigrants | Liberia | 0.0 /100 | #322 | Tragic 18.7% |