Alsatian vs Immigrants from Cuba Male Disability
COMPARE
Alsatian
Immigrants from Cuba
Male Disability
Male Disability Comparison
Alsatians
Immigrants from Cuba
11.7%
MALE DISABILITY
3.3/ 100
METRIC RATING
222nd/ 347
METRIC RANK
10.9%
MALE DISABILITY
90.2/ 100
METRIC RATING
118th/ 347
METRIC RANK
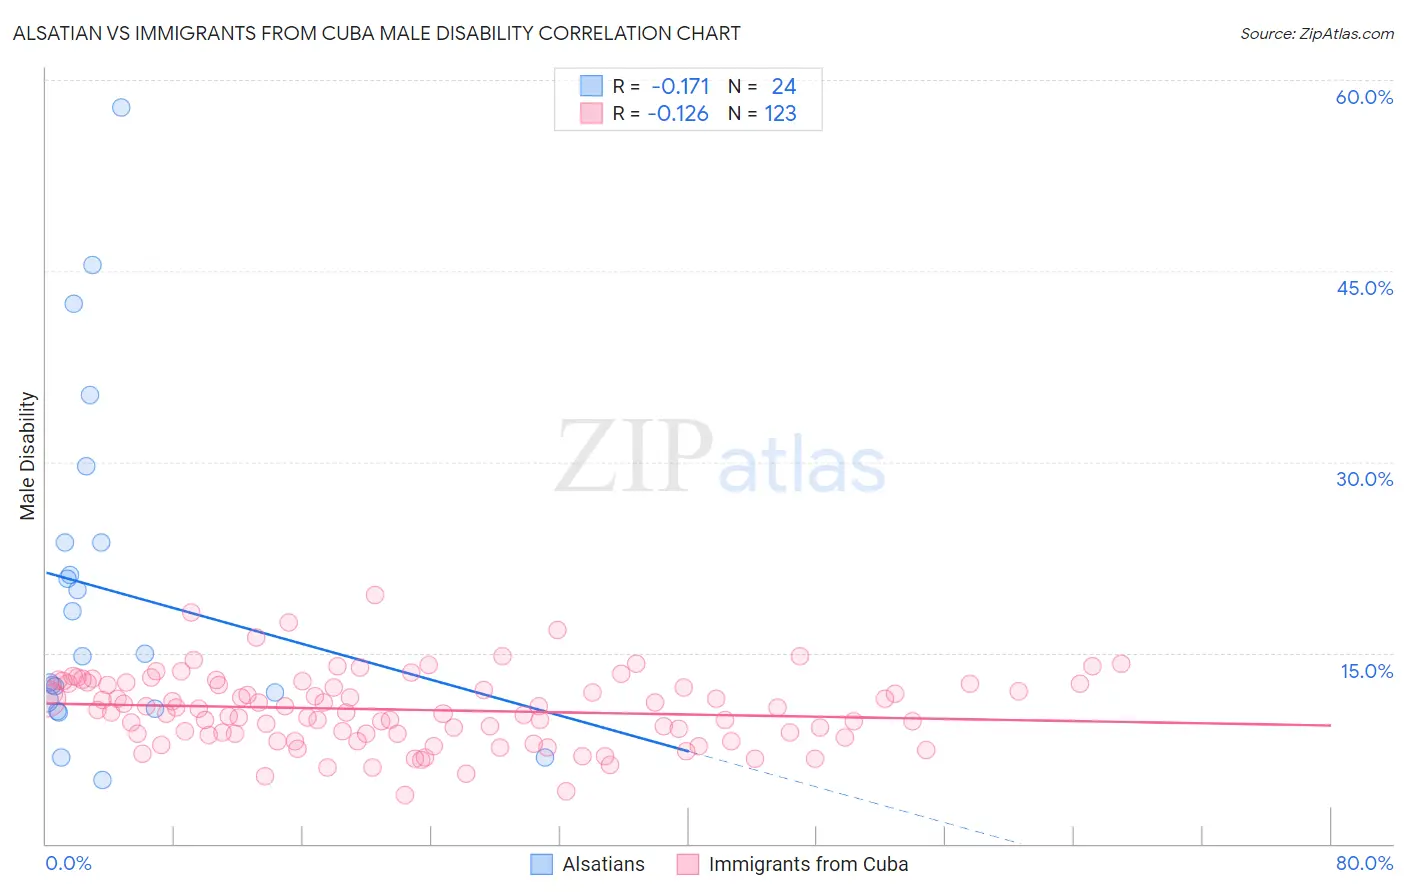
Alsatian vs Immigrants from Cuba Male Disability Correlation Chart
The statistical analysis conducted on geographies consisting of 82,682,247 people shows a poor negative correlation between the proportion of Alsatians and percentage of males with a disability in the United States with a correlation coefficient (R) of -0.171 and weighted average of 11.7%. Similarly, the statistical analysis conducted on geographies consisting of 325,990,586 people shows a poor negative correlation between the proportion of Immigrants from Cuba and percentage of males with a disability in the United States with a correlation coefficient (R) of -0.126 and weighted average of 10.9%, a difference of 8.0%.
Male Disability Correlation Summary
| Measurement | Alsatian | Immigrants from Cuba |
| Minimum | 5.0% | 3.8% |
| Maximum | 57.8% | 19.5% |
| Range | 52.8% | 15.7% |
| Mean | 19.9% | 10.5% |
| Median | 14.9% | 10.5% |
| Interquartile 25% (IQ1) | 10.9% | 8.6% |
| Interquartile 75% (IQ3) | 23.6% | 12.6% |
| Interquartile Range (IQR) | 12.7% | 4.0% |
| Standard Deviation (Sample) | 13.4% | 2.9% |
| Standard Deviation (Population) | 13.1% | 2.8% |
Similar Demographics by Male Disability
Demographics Similar to Alsatians by Male Disability
In terms of male disability, the demographic groups most similar to Alsatians are Immigrants from Bahamas (11.7%, a difference of 0.080%), Japanese (11.7%, a difference of 0.11%), Liberian (11.8%, a difference of 0.12%), Immigrants from Congo (11.7%, a difference of 0.15%), and Panamanian (11.7%, a difference of 0.17%).
| Demographics | Rating | Rank | Male Disability |
| Indonesians | 5.9 /100 | #215 | Tragic 11.6% |
| Immigrants | Dominican Republic | 4.9 /100 | #216 | Tragic 11.7% |
| Immigrants | Dominica | 4.6 /100 | #217 | Tragic 11.7% |
| Immigrants | England | 4.0 /100 | #218 | Tragic 11.7% |
| Panamanians | 3.8 /100 | #219 | Tragic 11.7% |
| Immigrants | Western Europe | 3.8 /100 | #220 | Tragic 11.7% |
| Immigrants | Congo | 3.7 /100 | #221 | Tragic 11.7% |
| Alsatians | 3.3 /100 | #222 | Tragic 11.7% |
| Immigrants | Bahamas | 3.2 /100 | #223 | Tragic 11.7% |
| Japanese | 3.1 /100 | #224 | Tragic 11.7% |
| Liberians | 3.1 /100 | #225 | Tragic 11.8% |
| Sub-Saharan Africans | 2.8 /100 | #226 | Tragic 11.8% |
| Austrians | 2.5 /100 | #227 | Tragic 11.8% |
| Hispanics or Latinos | 2.3 /100 | #228 | Tragic 11.8% |
| Bermudans | 2.3 /100 | #229 | Tragic 11.8% |
Demographics Similar to Immigrants from Cuba by Male Disability
In terms of male disability, the demographic groups most similar to Immigrants from Cuba are Armenian (10.9%, a difference of 0.0%), Eastern European (10.9%, a difference of 0.080%), Immigrants from Africa (10.9%, a difference of 0.11%), Immigrants from South Eastern Asia (10.9%, a difference of 0.15%), and Immigrants from Ghana (10.9%, a difference of 0.17%).
| Demographics | Rating | Rank | Male Disability |
| Immigrants | Uruguay | 93.8 /100 | #111 | Exceptional 10.8% |
| Ghanaians | 93.4 /100 | #112 | Exceptional 10.8% |
| Immigrants | Zimbabwe | 93.0 /100 | #113 | Exceptional 10.8% |
| Central Americans | 92.7 /100 | #114 | Exceptional 10.8% |
| Immigrants | Barbados | 92.2 /100 | #115 | Exceptional 10.8% |
| Immigrants | South Africa | 91.8 /100 | #116 | Exceptional 10.8% |
| Eastern Europeans | 90.6 /100 | #117 | Exceptional 10.9% |
| Immigrants | Cuba | 90.2 /100 | #118 | Exceptional 10.9% |
| Armenians | 90.1 /100 | #119 | Exceptional 10.9% |
| Immigrants | Africa | 89.4 /100 | #120 | Excellent 10.9% |
| Immigrants | South Eastern Asia | 89.2 /100 | #121 | Excellent 10.9% |
| Immigrants | Ghana | 89.0 /100 | #122 | Excellent 10.9% |
| Immigrants | Czechoslovakia | 88.4 /100 | #123 | Excellent 10.9% |
| South American Indians | 88.1 /100 | #124 | Excellent 10.9% |
| Immigrants | North Macedonia | 88.1 /100 | #125 | Excellent 10.9% |