Immigrants from West Indies vs Fijian Vision Disability
COMPARE
Immigrants from West Indies
Fijian
Vision Disability
Vision Disability Comparison
Immigrants from West Indies
Fijians
2.3%
VISION DISABILITY
0.6/ 100
METRIC RATING
244th/ 347
METRIC RANK
2.4%
VISION DISABILITY
0.1/ 100
METRIC RATING
261st/ 347
METRIC RANK
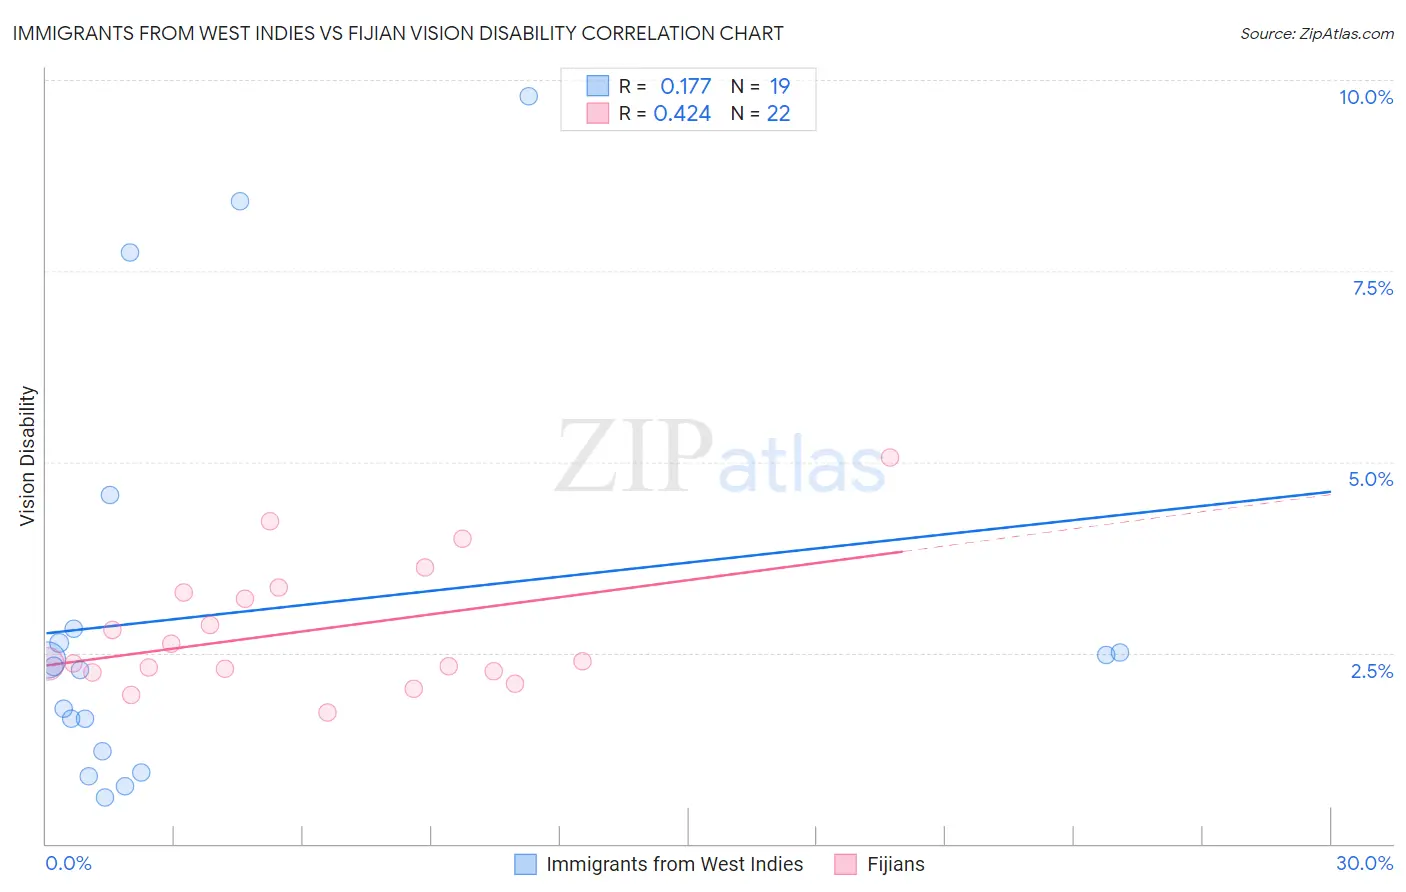
Immigrants from West Indies vs Fijian Vision Disability Correlation Chart
The statistical analysis conducted on geographies consisting of 72,450,769 people shows a poor positive correlation between the proportion of Immigrants from West Indies and percentage of population with vision disability in the United States with a correlation coefficient (R) of 0.177 and weighted average of 2.3%. Similarly, the statistical analysis conducted on geographies consisting of 55,940,410 people shows a moderate positive correlation between the proportion of Fijians and percentage of population with vision disability in the United States with a correlation coefficient (R) of 0.424 and weighted average of 2.4%, a difference of 2.0%.
Vision Disability Correlation Summary
| Measurement | Immigrants from West Indies | Fijian |
| Minimum | 0.61% | 1.7% |
| Maximum | 9.8% | 5.1% |
| Range | 9.2% | 3.3% |
| Mean | 3.0% | 2.8% |
| Median | 2.3% | 2.4% |
| Interquartile 25% (IQ1) | 1.2% | 2.3% |
| Interquartile 75% (IQ3) | 2.8% | 3.3% |
| Interquartile Range (IQR) | 1.6% | 1.0% |
| Standard Deviation (Sample) | 2.7% | 0.84% |
| Standard Deviation (Population) | 2.6% | 0.82% |
Demographics Similar to Immigrants from West Indies and Fijians by Vision Disability
In terms of vision disability, the demographic groups most similar to Immigrants from West Indies are Immigrants from Nicaragua (2.3%, a difference of 0.0%), Alsatian (2.3%, a difference of 0.090%), French (2.3%, a difference of 0.24%), Guatemalan (2.3%, a difference of 0.28%), and Subsaharan African (2.3%, a difference of 0.30%). Similarly, the demographic groups most similar to Fijians are Jamaican (2.4%, a difference of 0.030%), Belizean (2.4%, a difference of 0.21%), White/Caucasian (2.4%, a difference of 0.38%), British West Indian (2.4%, a difference of 0.40%), and West Indian (2.4%, a difference of 0.42%).
| Demographics | Rating | Rank | Vision Disability |
| Immigrants | Panama | 0.8 /100 | #242 | Tragic 2.3% |
| Immigrants | Nicaragua | 0.6 /100 | #243 | Tragic 2.3% |
| Immigrants | West Indies | 0.6 /100 | #244 | Tragic 2.3% |
| Alsatians | 0.6 /100 | #245 | Tragic 2.3% |
| French | 0.5 /100 | #246 | Tragic 2.3% |
| Guatemalans | 0.5 /100 | #247 | Tragic 2.3% |
| Sub-Saharan Africans | 0.5 /100 | #248 | Tragic 2.3% |
| Liberians | 0.5 /100 | #249 | Tragic 2.3% |
| Bangladeshis | 0.5 /100 | #250 | Tragic 2.3% |
| Immigrants | Laos | 0.4 /100 | #251 | Tragic 2.4% |
| Immigrants | Micronesia | 0.3 /100 | #252 | Tragic 2.4% |
| Japanese | 0.3 /100 | #253 | Tragic 2.4% |
| Haitians | 0.3 /100 | #254 | Tragic 2.4% |
| Immigrants | Guatemala | 0.3 /100 | #255 | Tragic 2.4% |
| Immigrants | Haiti | 0.2 /100 | #256 | Tragic 2.4% |
| West Indians | 0.2 /100 | #257 | Tragic 2.4% |
| British West Indians | 0.2 /100 | #258 | Tragic 2.4% |
| Whites/Caucasians | 0.2 /100 | #259 | Tragic 2.4% |
| Belizeans | 0.2 /100 | #260 | Tragic 2.4% |
| Fijians | 0.1 /100 | #261 | Tragic 2.4% |
| Jamaicans | 0.1 /100 | #262 | Tragic 2.4% |