Native/Alaskan vs Immigrants from Panama Associate's Degree
COMPARE
Native/Alaskan
Immigrants from Panama
Associate's Degree
Associate's Degree Comparison
Natives/Alaskans
Immigrants from Panama
34.9%
ASSOCIATE'S DEGREE
0.0/ 100
METRIC RATING
334th/ 347
METRIC RANK
44.7%
ASSOCIATE'S DEGREE
12.4/ 100
METRIC RATING
215th/ 347
METRIC RANK
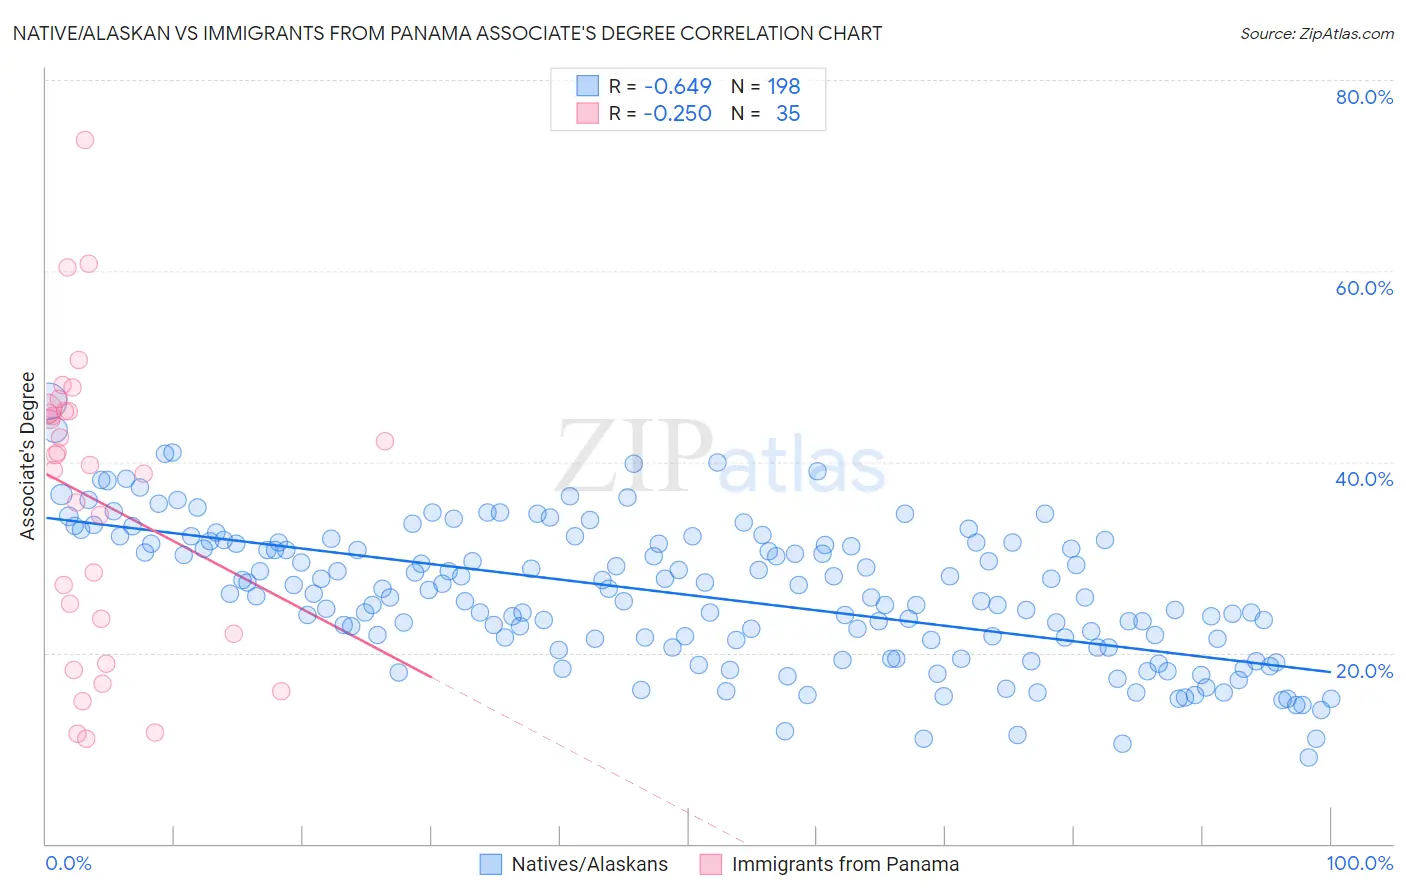
Native/Alaskan vs Immigrants from Panama Associate's Degree Correlation Chart
The statistical analysis conducted on geographies consisting of 513,021,509 people shows a significant negative correlation between the proportion of Natives/Alaskans and percentage of population with at least associate's degree education in the United States with a correlation coefficient (R) of -0.649 and weighted average of 34.9%. Similarly, the statistical analysis conducted on geographies consisting of 221,180,588 people shows a weak negative correlation between the proportion of Immigrants from Panama and percentage of population with at least associate's degree education in the United States with a correlation coefficient (R) of -0.250 and weighted average of 44.7%, a difference of 27.9%.
Associate's Degree Correlation Summary
| Measurement | Native/Alaskan | Immigrants from Panama |
| Minimum | 9.1% | 11.1% |
| Maximum | 46.4% | 73.8% |
| Range | 37.3% | 62.7% |
| Mean | 26.1% | 35.9% |
| Median | 26.1% | 39.6% |
| Interquartile 25% (IQ1) | 21.3% | 22.0% |
| Interquartile 75% (IQ3) | 31.5% | 45.4% |
| Interquartile Range (IQR) | 10.2% | 23.4% |
| Standard Deviation (Sample) | 7.2% | 15.5% |
| Standard Deviation (Population) | 7.2% | 15.3% |
Similar Demographics by Associate's Degree
Demographics Similar to Natives/Alaskans by Associate's Degree
In terms of associate's degree, the demographic groups most similar to Natives/Alaskans are Spanish American Indian (34.9%, a difference of 0.14%), Mexican (35.0%, a difference of 0.24%), Immigrants from Central America (35.0%, a difference of 0.31%), Hopi (34.6%, a difference of 1.0%), and Immigrants from the Azores (35.6%, a difference of 2.1%).
| Demographics | Rating | Rank | Associate's Degree |
| Dutch West Indians | 0.0 /100 | #327 | Tragic 36.5% |
| Alaskan Athabascans | 0.0 /100 | #328 | Tragic 36.5% |
| Paiute | 0.0 /100 | #329 | Tragic 36.4% |
| Apache | 0.0 /100 | #330 | Tragic 36.2% |
| Immigrants | Azores | 0.0 /100 | #331 | Tragic 35.6% |
| Immigrants | Central America | 0.0 /100 | #332 | Tragic 35.0% |
| Mexicans | 0.0 /100 | #333 | Tragic 35.0% |
| Natives/Alaskans | 0.0 /100 | #334 | Tragic 34.9% |
| Spanish American Indians | 0.0 /100 | #335 | Tragic 34.9% |
| Hopi | 0.0 /100 | #336 | Tragic 34.6% |
| Lumbee | 0.0 /100 | #337 | Tragic 34.1% |
| Pueblo | 0.0 /100 | #338 | Tragic 34.0% |
| Immigrants | Mexico | 0.0 /100 | #339 | Tragic 33.7% |
| Navajo | 0.0 /100 | #340 | Tragic 32.6% |
| Inupiat | 0.0 /100 | #341 | Tragic 32.6% |
Demographics Similar to Immigrants from Panama by Associate's Degree
In terms of associate's degree, the demographic groups most similar to Immigrants from Panama are Immigrants from Middle Africa (44.7%, a difference of 0.060%), Immigrants from Nigeria (44.6%, a difference of 0.18%), Immigrants from Ghana (44.8%, a difference of 0.31%), Immigrants (44.5%, a difference of 0.37%), and French Canadian (44.9%, a difference of 0.43%).
| Demographics | Rating | Rank | Associate's Degree |
| Dutch | 17.6 /100 | #208 | Poor 45.0% |
| Immigrants | Costa Rica | 16.7 /100 | #209 | Poor 45.0% |
| Immigrants | Philippines | 16.7 /100 | #210 | Poor 45.0% |
| Immigrants | Zaire | 16.6 /100 | #211 | Poor 45.0% |
| French Canadians | 15.0 /100 | #212 | Poor 44.9% |
| Immigrants | Ghana | 14.2 /100 | #213 | Poor 44.8% |
| Immigrants | Middle Africa | 12.7 /100 | #214 | Poor 44.7% |
| Immigrants | Panama | 12.4 /100 | #215 | Poor 44.7% |
| Immigrants | Nigeria | 11.4 /100 | #216 | Poor 44.6% |
| Immigrants | Immigrants | 10.5 /100 | #217 | Poor 44.5% |
| Spanish | 9.4 /100 | #218 | Tragic 44.4% |
| Whites/Caucasians | 7.5 /100 | #219 | Tragic 44.2% |
| Portuguese | 7.2 /100 | #220 | Tragic 44.1% |
| Immigrants | Western Africa | 6.6 /100 | #221 | Tragic 44.1% |
| Barbadians | 5.8 /100 | #222 | Tragic 43.9% |