Native Hawaiian vs Immigrants from Bulgaria Unemployment Among Ages 60 to 64 years
COMPARE
Native Hawaiian
Immigrants from Bulgaria
Unemployment Among Ages 60 to 64 years
Unemployment Among Ages 60 to 64 years Comparison
Native Hawaiians
Immigrants from Bulgaria
4.5%
UNEMPLOYMENT AMONG AGES 60 TO 64 YEARS
100.0/ 100
METRIC RATING
38th/ 347
METRIC RANK
4.7%
UNEMPLOYMENT AMONG AGES 60 TO 64 YEARS
98.7/ 100
METRIC RATING
88th/ 347
METRIC RANK
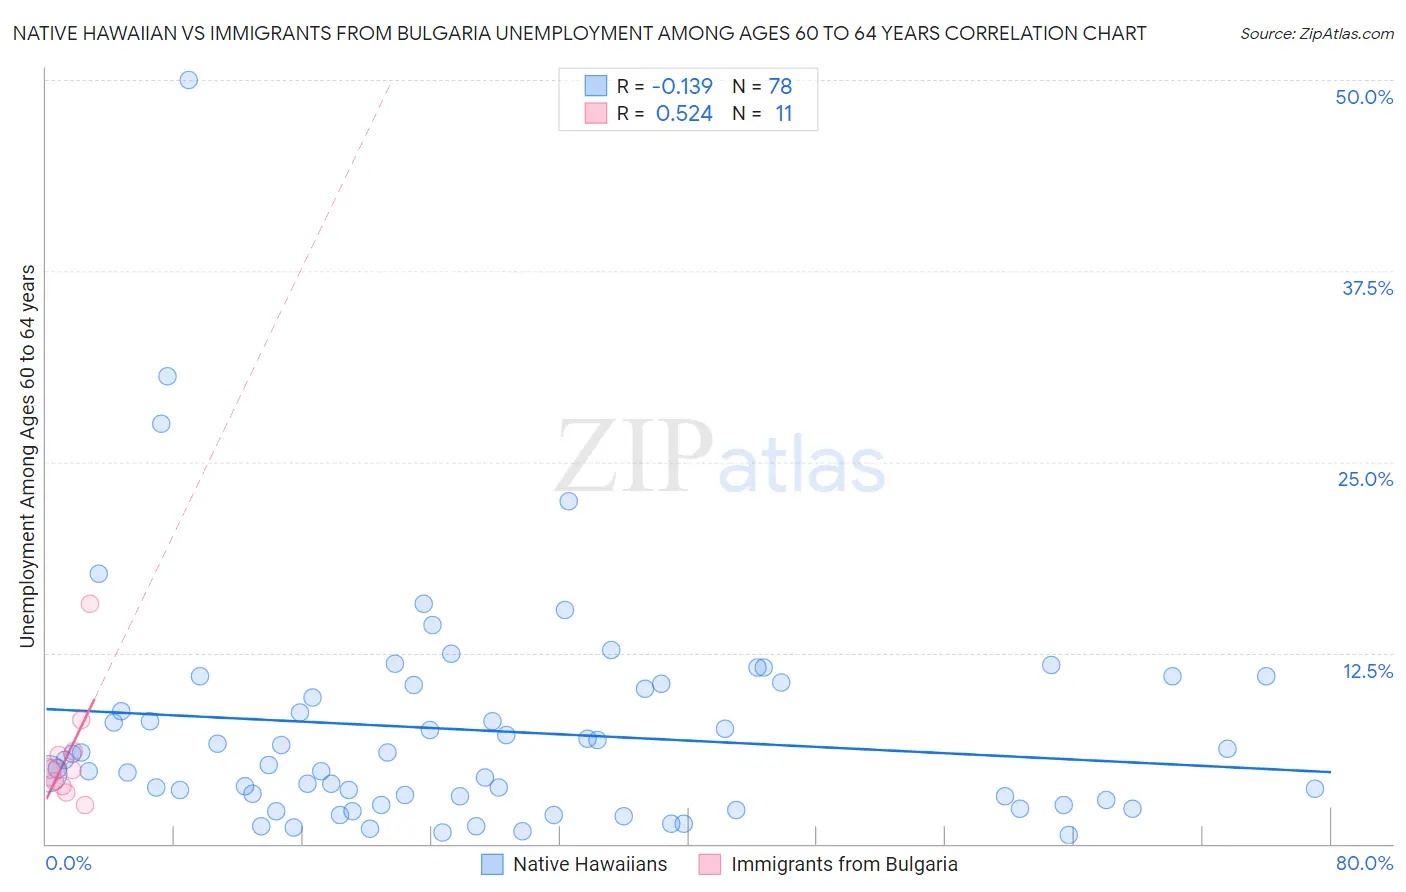
Native Hawaiian vs Immigrants from Bulgaria Unemployment Among Ages 60 to 64 years Correlation Chart
The statistical analysis conducted on geographies consisting of 302,694,280 people shows a poor negative correlation between the proportion of Native Hawaiians and unemployment rate among population between the ages 60 and 64 in the United States with a correlation coefficient (R) of -0.139 and weighted average of 4.5%. Similarly, the statistical analysis conducted on geographies consisting of 165,737,391 people shows a substantial positive correlation between the proportion of Immigrants from Bulgaria and unemployment rate among population between the ages 60 and 64 in the United States with a correlation coefficient (R) of 0.524 and weighted average of 4.7%, a difference of 3.8%.
Unemployment Among Ages 60 to 64 years Correlation Summary
| Measurement | Native Hawaiian | Immigrants from Bulgaria |
| Minimum | 0.60% | 2.5% |
| Maximum | 50.0% | 15.7% |
| Range | 49.4% | 13.2% |
| Mean | 7.4% | 5.8% |
| Median | 5.3% | 4.8% |
| Interquartile 25% (IQ1) | 2.9% | 3.8% |
| Interquartile 75% (IQ3) | 10.4% | 6.1% |
| Interquartile Range (IQR) | 7.5% | 2.3% |
| Standard Deviation (Sample) | 7.5% | 3.6% |
| Standard Deviation (Population) | 7.5% | 3.4% |
Similar Demographics by Unemployment Among Ages 60 to 64 years
Demographics Similar to Native Hawaiians by Unemployment Among Ages 60 to 64 years
In terms of unemployment among ages 60 to 64 years, the demographic groups most similar to Native Hawaiians are Iraqi (4.5%, a difference of 0.0%), Scandinavian (4.5%, a difference of 0.15%), Immigrants from Portugal (4.5%, a difference of 0.20%), Venezuelan (4.5%, a difference of 0.23%), and German (4.5%, a difference of 0.24%).
| Demographics | Rating | Rank | Unemployment Among Ages 60 to 64 years |
| Immigrants | Eritrea | 100.0 /100 | #31 | Exceptional 4.5% |
| Zimbabweans | 100.0 /100 | #32 | Exceptional 4.5% |
| Carpatho Rusyns | 100.0 /100 | #33 | Exceptional 4.5% |
| Belgians | 100.0 /100 | #34 | Exceptional 4.5% |
| Germans | 100.0 /100 | #35 | Exceptional 4.5% |
| Venezuelans | 100.0 /100 | #36 | Exceptional 4.5% |
| Immigrants | Portugal | 100.0 /100 | #37 | Exceptional 4.5% |
| Native Hawaiians | 100.0 /100 | #38 | Exceptional 4.5% |
| Iraqis | 100.0 /100 | #39 | Exceptional 4.5% |
| Scandinavians | 100.0 /100 | #40 | Exceptional 4.5% |
| Immigrants | Sudan | 100.0 /100 | #41 | Exceptional 4.5% |
| English | 100.0 /100 | #42 | Exceptional 4.5% |
| Swedes | 100.0 /100 | #43 | Exceptional 4.5% |
| Europeans | 100.0 /100 | #44 | Exceptional 4.5% |
| Liberians | 99.9 /100 | #45 | Exceptional 4.5% |
Demographics Similar to Immigrants from Bulgaria by Unemployment Among Ages 60 to 64 years
In terms of unemployment among ages 60 to 64 years, the demographic groups most similar to Immigrants from Bulgaria are Immigrants from Northern Africa (4.7%, a difference of 0.0%), Immigrants from Liberia (4.7%, a difference of 0.050%), Immigrants from Jordan (4.7%, a difference of 0.070%), Immigrants from Oceania (4.7%, a difference of 0.11%), and Thai (4.7%, a difference of 0.13%).
| Demographics | Rating | Rank | Unemployment Among Ages 60 to 64 years |
| Iroquois | 99.1 /100 | #81 | Exceptional 4.7% |
| Okinawans | 99.1 /100 | #82 | Exceptional 4.7% |
| Immigrants | Egypt | 99.1 /100 | #83 | Exceptional 4.7% |
| Thais | 98.9 /100 | #84 | Exceptional 4.7% |
| Immigrants | Sri Lanka | 98.9 /100 | #85 | Exceptional 4.7% |
| Immigrants | Oceania | 98.9 /100 | #86 | Exceptional 4.7% |
| Immigrants | Jordan | 98.8 /100 | #87 | Exceptional 4.7% |
| Immigrants | Bulgaria | 98.7 /100 | #88 | Exceptional 4.7% |
| Immigrants | Northern Africa | 98.7 /100 | #89 | Exceptional 4.7% |
| Immigrants | Liberia | 98.7 /100 | #90 | Exceptional 4.7% |
| Immigrants | Uganda | 98.4 /100 | #91 | Exceptional 4.7% |
| Romanians | 98.4 /100 | #92 | Exceptional 4.7% |
| Immigrants | Saudi Arabia | 98.3 /100 | #93 | Exceptional 4.7% |
| Immigrants | Kuwait | 98.3 /100 | #94 | Exceptional 4.7% |
| Serbians | 98.2 /100 | #95 | Exceptional 4.7% |