Moroccan vs Immigrants from Bosnia and Herzegovina Disability Age Over 75

COMPARE

Moroccan
Race
Ancestry
AfghanAfricanAlaska NativeAlaskan AthabascanAlbanianAleutAlsatianAmericanApacheArabArapahoArgentineanArmenianAssyrian/Chaldean/SyriacAustralianAustrianBahamianBangladeshiBarbadianBasqueBelgianBelizeanBermudanBhutaneseBlackfeetBolivianBrazilianBritishBritish West IndianBulgarianBurmeseCajunCambodianCanadianCape VerdeanCarpatho RusynCelticCentral AmericanCentral American IndianCherokeeCheyenneChickasawChileanChineseChippewaChoctawColombianColvilleComancheCosta RicanCreeCreekCroatianCrowCubanCypriotCzechCzechoslovakianDanishDelawareDominicanDutchDutch West IndianEastern EuropeanEcuadorianEgyptianEnglishEstonianEthiopianEuropeanFijianFilipinoFinnishFrenchFrench American IndianFrench CanadianGermanGerman RussianGhanaianGreekGuamanian/ChamorroGuatemalanGuyaneseHaitianHmongHonduranHopiHoumaHungarianIcelanderIndian (Asian)IndonesianInupiatIranianIraqiIrishIroquoisIsraeliItalianJamaicanJapaneseJordanianKenyanKiowaKoreanLaotianLatvianLebaneseLiberianLithuanianLumbeeLuxembourgerMacedonianMalaysianMalteseMarshalleseMenomineeMexicanMexican American IndianMongolianMoroccanNative HawaiianNavajoNepaleseNew ZealanderNicaraguanNigerianNorthern EuropeanNorwegianOkinawanOsageOttawaPaiutePakistaniPalestinianPanamanianParaguayanPennsylvania GermanPeruvianPimaPolishPortuguesePotawatomiPuebloPuerto RicanPuget Sound SalishRomanianRussianSalvadoranSamoanScandinavianScotch-IrishScottishSeminoleSenegaleseSerbianShoshoneSierra LeoneanSiouxSlavicSlovakSloveneSomaliSouth AfricanSouth AmericanSouth American IndianSoviet UnionSpaniardSpanishSpanish AmericanSpanish American IndianSri LankanSubsaharan AfricanSudaneseSwedishSwissSyrianTaiwaneseThaiTlingit-HaidaTohono O'OdhamTonganTrinidadian and TobagonianTsimshianTurkishU.S. Virgin IslanderUgandanUkrainianUruguayanUteVenezuelanVietnameseWelshWest IndianYakamaYaquiYugoslavianYumanYup'ikZimbabwean
Immigration
NonimmigrantsImmigrantsAfghanistanAfricaAlbaniaArgentinaArmeniaAsiaAustraliaAustriaBahamasBangladeshBarbadosBelarusBelgiumBelizeBoliviaBrazilBulgariaBurma/MyanmarCabo VerdeCambodiaCameroonCanadaCaribbeanCentral AmericaChileChinaColombiaCongoCosta RicaCroatiaCubaCzechoslovakiaDenmarkDominicaDominican RepublicEastern AfricaEastern AsiaEastern EuropeEcuadorEgyptEl SalvadorEnglandEritreaEthiopiaEuropeFijiFranceGermanyGhanaGreeceGrenadaGuatemalaGuyanaHaitiHondurasHong KongHungaryIndiaIndonesiaIranIraqIrelandIsraelItalyJamaicaJapanJordanKazakhstanKenyaKoreaKuwaitLaosLatin AmericaLatviaLebanonLiberiaLithuaniaMalaysiaMexicoMicronesiaMiddle AfricaMoldovaMoroccoNepalNetherlandsNicaraguaNigeriaNorth AmericaNorth MacedoniaNorthern AfricaNorthern EuropeNorwayOceaniaPakistanPanamaPeruPhilippinesPolandPortugalRomaniaRussiaSaudi ArabiaScotlandSenegalSerbiaSierra LeoneSingaporeSomaliaSouth AfricaSouth AmericaSouth Central AsiaSouth Eastern AsiaSouthern EuropeSpainSri LankaSt. Vincent and the GrenadinesSudanSwedenSwitzerlandSyriaTaiwanThailandTrinidad and TobagoTurkeyUgandaUkraineUruguayUzbekistanVenezuelaVietnamWest IndiesWestern AfricaWestern AsiaWestern EuropeYemenZaireZimbabweAzores
Immigrants from Bosnia and Herzegovina
Race
Ancestry
AfghanAfricanAlaska NativeAlaskan AthabascanAlbanianAleutAlsatianAmericanApacheArabArapahoArgentineanArmenianAssyrian/Chaldean/SyriacAustralianAustrianBahamianBangladeshiBarbadianBasqueBelgianBelizeanBermudanBhutaneseBlackfeetBolivianBrazilianBritishBritish West IndianBulgarianBurmeseCajunCambodianCanadianCape VerdeanCarpatho RusynCelticCentral AmericanCentral American IndianCherokeeCheyenneChickasawChileanChineseChippewaChoctawColombianColvilleComancheCosta RicanCreeCreekCroatianCrowCubanCypriotCzechCzechoslovakianDanishDelawareDominicanDutchDutch West IndianEastern EuropeanEcuadorianEgyptianEnglishEstonianEthiopianEuropeanFijianFilipinoFinnishFrenchFrench American IndianFrench CanadianGermanGerman RussianGhanaianGreekGuamanian/ChamorroGuatemalanGuyaneseHaitianHmongHonduranHopiHoumaHungarianIcelanderIndian (Asian)IndonesianInupiatIranianIraqiIrishIroquoisIsraeliItalianJamaicanJapaneseJordanianKenyanKiowaKoreanLaotianLatvianLebaneseLiberianLithuanianLumbeeLuxembourgerMacedonianMalaysianMalteseMarshalleseMenomineeMexicanMexican American IndianMongolianNative HawaiianNavajoNepaleseNew ZealanderNicaraguanNigerianNorthern EuropeanNorwegianOkinawanOsageOttawaPaiutePakistaniPalestinianPanamanianParaguayanPennsylvania GermanPeruvianPimaPolishPortuguesePotawatomiPuebloPuerto RicanPuget Sound SalishRomanianRussianSalvadoranSamoanScandinavianScotch-IrishScottishSeminoleSenegaleseSerbianShoshoneSierra LeoneanSiouxSlavicSlovakSloveneSomaliSouth AfricanSouth AmericanSouth American IndianSoviet UnionSpaniardSpanishSpanish AmericanSpanish American IndianSri LankanSubsaharan AfricanSudaneseSwedishSwissSyrianTaiwaneseThaiTlingit-HaidaTohono O'OdhamTonganTrinidadian and TobagonianTsimshianTurkishU.S. Virgin IslanderUgandanUkrainianUruguayanUteVenezuelanVietnameseWelshWest IndianYakamaYaquiYugoslavianYumanYup'ikZimbabwean
Immigration
NonimmigrantsImmigrantsAfghanistanAfricaAlbaniaArgentinaArmeniaAsiaAustraliaAustriaBahamasBangladeshBarbadosBelarusBelgiumBelizeBoliviaBosnia and HerzegovinaBrazilBulgariaBurma/MyanmarCabo VerdeCambodiaCameroonCanadaCaribbeanCentral AmericaChileChinaColombiaCongoCosta RicaCroatiaCubaCzechoslovakiaDenmarkDominicaDominican RepublicEastern AfricaEastern AsiaEastern EuropeEcuadorEgyptEl SalvadorEnglandEritreaEthiopiaEuropeFijiFranceGermanyGhanaGreeceGrenadaGuatemalaGuyanaHaitiHondurasHong KongHungaryIndiaIndonesiaIranIraqIrelandIsraelItalyJamaicaJapanJordanKazakhstanKenyaKoreaKuwaitLaosLatin AmericaLatviaLebanonLiberiaLithuaniaMalaysiaMexicoMicronesiaMiddle AfricaMoldovaMoroccoNepalNetherlandsNicaraguaNigeriaNorth AmericaNorth MacedoniaNorthern AfricaNorthern EuropeNorwayOceaniaPakistanPanamaPeruPhilippinesPolandPortugalRomaniaRussiaSaudi ArabiaScotlandSenegalSerbiaSierra LeoneSingaporeSomaliaSouth AfricaSouth AmericaSouth Central AsiaSouth Eastern AsiaSouthern EuropeSpainSri LankaSt. Vincent and the GrenadinesSudanSwedenSwitzerlandSyriaTaiwanThailandTrinidad and TobagoTurkeyUgandaUkraineUruguayUzbekistanVenezuelaVietnamWest IndiesWestern AfricaWestern AsiaWestern EuropeYemenZaireZimbabweAzores
Disability Age Over 75
Income
Poverty
Unemployment
Labor Participation
Family Structure
Vehicle Availability
Education Level
Disability

Disability Age Over 75 Comparison

Moroccans

Immigrants from Bosnia and Herzegovina

Good
Excellent
47.2%
DISABILITY AGE OVER 75
62.9/ 100
METRIC RATING
167th/ 347
METRIC RANK
46.8%
DISABILITY AGE OVER 75
88.5/ 100
METRIC RATING
138th/ 347
METRIC RANK

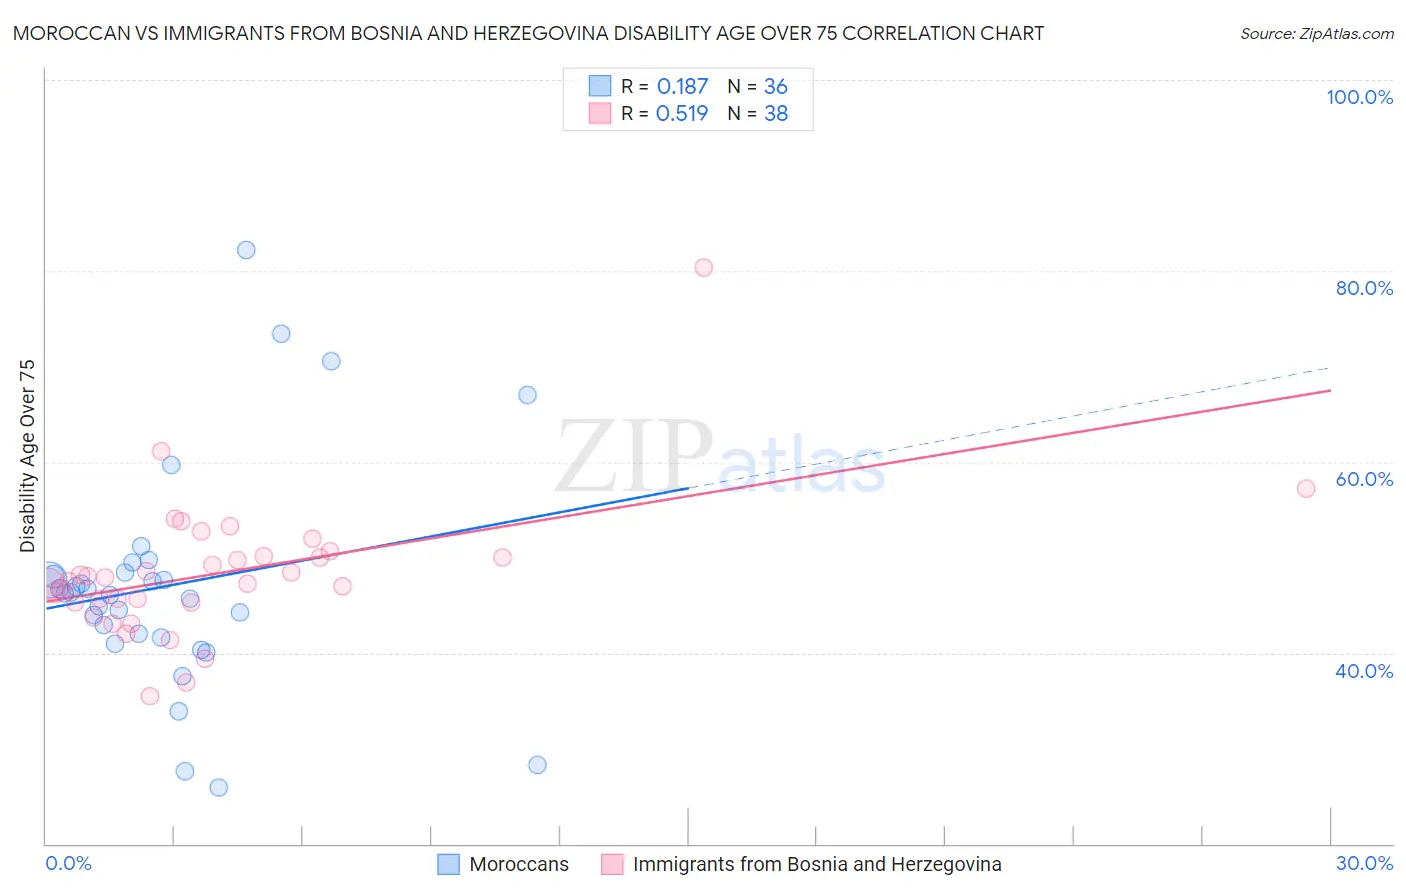
Moroccan vs Immigrants from Bosnia and Herzegovina Disability Age Over 75 Correlation Chart

The statistical analysis conducted on geographies consisting of 201,702,915 people shows a poor positive correlation between the proportion of Moroccans and percentage of population with a disability over the age of 75 in the United States with a correlation coefficient (R) of 0.187 and weighted average of 47.2%. Similarly, the statistical analysis conducted on geographies consisting of 156,769,523 people shows a substantial positive correlation between the proportion of Immigrants from Bosnia and Herzegovina and percentage of population with a disability over the age of 75 in the United States with a correlation coefficient (R) of 0.519 and weighted average of 46.8%, a difference of 0.86%.
Moroccan vs Immigrants from Bosnia and Herzegovina Disability Age Over 75

Disability Age Over 75 Correlation Summary

MeasurementMoroccanImmigrants from Bosnia and Herzegovina
Minimum25.9%35.4%
Maximum82.2%80.4%
Range56.4%45.0%
Mean47.0%48.4%
Median46.3%47.7%
Interquartile 25% (IQ1)41.8%45.3%
Interquartile 75% (IQ3)48.2%50.1%
Interquartile Range (IQR)6.4%4.8%
Standard Deviation (Sample)11.7%7.4%
Standard Deviation (Population)11.5%7.3%

Similar Demographics by Disability Age Over 75

Demographics Similar to Moroccans by Disability Age Over 75

In terms of disability age over 75, the demographic groups most similar to Moroccans are French (47.2%, a difference of 0.040%), Immigrants from Zimbabwe (47.2%, a difference of 0.040%), Immigrants from Sierra Leone (47.2%, a difference of 0.040%), Immigrants from Eastern Africa (47.2%, a difference of 0.070%), and Pennsylvania German (47.2%, a difference of 0.080%).
DemographicsRating | RankDisability Age Over 75
Immigrants | Middle Africa
68.3
/100
|
#160
Good
47.1%
South American Indians
68.1
/100
|
#161
Good
47.1%
Pennsylvania Germans
66.0
/100
|
#162
Good
47.2%
Immigrants | Eastern Africa
65.5
/100
|
#163
Good
47.2%
French
64.6
/100
|
#164
Good
47.2%
Immigrants | Zimbabwe
64.4
/100
|
#165
Good
47.2%
Immigrants | Sierra Leone
64.4
/100
|
#166
Good
47.2%
Moroccans
62.9
/100
|
#167
Good
47.2%
Kenyans
58.8
/100
|
#168
Average
47.2%
Celtics
58.7
/100
|
#169
Average
47.2%
German Russians
56.2
/100
|
#170
Average
47.3%
Immigrants | Africa
53.6
/100
|
#171
Average
47.3%
Scotch-Irish
52.5
/100
|
#172
Average
47.3%
Alsatians
51.9
/100
|
#173
Average
47.3%
Whites/Caucasians
50.0
/100
|
#174
Average
47.3%

Demographics Similar to Immigrants from Bosnia and Herzegovina by Disability Age Over 75

In terms of disability age over 75, the demographic groups most similar to Immigrants from Bosnia and Herzegovina are Immigrants from Uganda (46.8%, a difference of 0.0%), Yugoslavian (46.8%, a difference of 0.0%), Immigrants from Venezuela (46.8%, a difference of 0.010%), Ethiopian (46.8%, a difference of 0.020%), and Immigrants from Ethiopia (46.8%, a difference of 0.040%).
DemographicsRating | RankDisability Age Over 75
Scottish
90.5
/100
|
#131
Exceptional
46.7%
South Americans
90.0
/100
|
#132
Excellent
46.8%
English
89.4
/100
|
#133
Excellent
46.8%
Immigrants | Ethiopia
89.1
/100
|
#134
Excellent
46.8%
Ethiopians
88.9
/100
|
#135
Excellent
46.8%
Immigrants | Venezuela
88.6
/100
|
#136
Excellent
46.8%
Immigrants | Uganda
88.5
/100
|
#137
Excellent
46.8%
Immigrants | Bosnia and Herzegovina
88.5
/100
|
#138
Excellent
46.8%
Yugoslavians
88.5
/100
|
#139
Excellent
46.8%
Immigrants | Costa Rica
87.4
/100
|
#140
Excellent
46.8%
Lebanese
87.0
/100
|
#141
Excellent
46.8%
Peruvians
86.5
/100
|
#142
Excellent
46.8%
Bermudans
85.6
/100
|
#143
Excellent
46.9%
Venezuelans
85.0
/100
|
#144
Excellent
46.9%
Costa Ricans
84.5
/100
|
#145
Excellent
46.9%