Moroccan vs Immigrants from West Indies Vision Disability
COMPARE
Moroccan
Immigrants from West Indies
Vision Disability
Vision Disability Comparison
Moroccans
Immigrants from West Indies
2.2%
VISION DISABILITY
35.4/ 100
METRIC RATING
184th/ 347
METRIC RANK
2.3%
VISION DISABILITY
0.6/ 100
METRIC RATING
244th/ 347
METRIC RANK
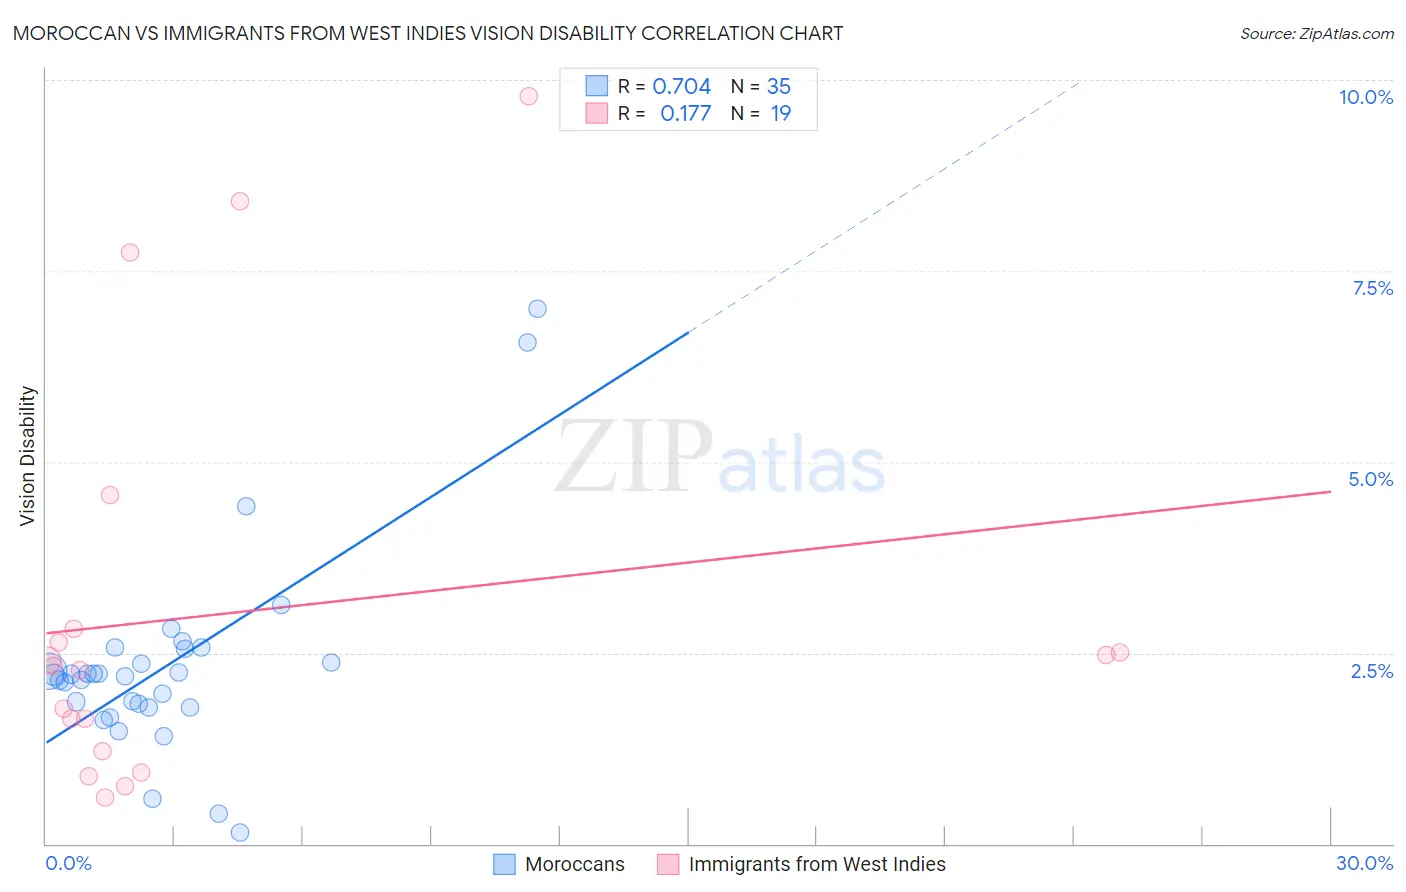
Moroccan vs Immigrants from West Indies Vision Disability Correlation Chart
The statistical analysis conducted on geographies consisting of 201,770,808 people shows a strong positive correlation between the proportion of Moroccans and percentage of population with vision disability in the United States with a correlation coefficient (R) of 0.704 and weighted average of 2.2%. Similarly, the statistical analysis conducted on geographies consisting of 72,450,769 people shows a poor positive correlation between the proportion of Immigrants from West Indies and percentage of population with vision disability in the United States with a correlation coefficient (R) of 0.177 and weighted average of 2.3%, a difference of 7.0%.
Vision Disability Correlation Summary
| Measurement | Moroccan | Immigrants from West Indies |
| Minimum | 0.15% | 0.61% |
| Maximum | 7.0% | 9.8% |
| Range | 6.9% | 9.2% |
| Mean | 2.3% | 3.0% |
| Median | 2.2% | 2.3% |
| Interquartile 25% (IQ1) | 1.8% | 1.2% |
| Interquartile 75% (IQ3) | 2.6% | 2.8% |
| Interquartile Range (IQR) | 0.77% | 1.6% |
| Standard Deviation (Sample) | 1.3% | 2.7% |
| Standard Deviation (Population) | 1.3% | 2.6% |
Similar Demographics by Vision Disability
Demographics Similar to Moroccans by Vision Disability
In terms of vision disability, the demographic groups most similar to Moroccans are Immigrants from Middle Africa (2.2%, a difference of 0.13%), Native Hawaiian (2.2%, a difference of 0.14%), Immigrants from Burma/Myanmar (2.2%, a difference of 0.17%), Costa Rican (2.2%, a difference of 0.36%), and Immigrants from St. Vincent and the Grenadines (2.2%, a difference of 0.36%).
| Demographics | Rating | Rank | Vision Disability |
| Slavs | 46.0 /100 | #177 | Average 2.2% |
| Immigrants | Oceania | 45.1 /100 | #178 | Average 2.2% |
| Immigrants | North America | 44.5 /100 | #179 | Average 2.2% |
| Uruguayans | 42.7 /100 | #180 | Average 2.2% |
| Immigrants | Western Europe | 41.1 /100 | #181 | Average 2.2% |
| Costa Ricans | 40.7 /100 | #182 | Average 2.2% |
| Immigrants | Burma/Myanmar | 37.9 /100 | #183 | Fair 2.2% |
| Moroccans | 35.4 /100 | #184 | Fair 2.2% |
| Immigrants | Middle Africa | 33.5 /100 | #185 | Fair 2.2% |
| Native Hawaiians | 33.3 /100 | #186 | Fair 2.2% |
| Immigrants | St. Vincent and the Grenadines | 30.3 /100 | #187 | Fair 2.2% |
| Guyanese | 28.9 /100 | #188 | Fair 2.2% |
| Salvadorans | 27.4 /100 | #189 | Fair 2.2% |
| Immigrants | Costa Rica | 26.1 /100 | #190 | Fair 2.2% |
| Canadians | 25.8 /100 | #191 | Fair 2.2% |
Demographics Similar to Immigrants from West Indies by Vision Disability
In terms of vision disability, the demographic groups most similar to Immigrants from West Indies are Immigrants from Nicaragua (2.3%, a difference of 0.0%), Alsatian (2.3%, a difference of 0.090%), French (2.3%, a difference of 0.24%), Guatemalan (2.3%, a difference of 0.28%), and Subsaharan African (2.3%, a difference of 0.30%).
| Demographics | Rating | Rank | Vision Disability |
| Immigrants | Portugal | 1.4 /100 | #237 | Tragic 2.3% |
| Immigrants | Cambodia | 1.1 /100 | #238 | Tragic 2.3% |
| English | 1.1 /100 | #239 | Tragic 2.3% |
| Panamanians | 0.9 /100 | #240 | Tragic 2.3% |
| Malaysians | 0.9 /100 | #241 | Tragic 2.3% |
| Immigrants | Panama | 0.8 /100 | #242 | Tragic 2.3% |
| Immigrants | Nicaragua | 0.6 /100 | #243 | Tragic 2.3% |
| Immigrants | West Indies | 0.6 /100 | #244 | Tragic 2.3% |
| Alsatians | 0.6 /100 | #245 | Tragic 2.3% |
| French | 0.5 /100 | #246 | Tragic 2.3% |
| Guatemalans | 0.5 /100 | #247 | Tragic 2.3% |
| Sub-Saharan Africans | 0.5 /100 | #248 | Tragic 2.3% |
| Liberians | 0.5 /100 | #249 | Tragic 2.3% |
| Bangladeshis | 0.5 /100 | #250 | Tragic 2.3% |
| Immigrants | Laos | 0.4 /100 | #251 | Tragic 2.4% |