Mongolian vs Immigrants from Nigeria 10th Grade
COMPARE
Mongolian
Immigrants from Nigeria
10th Grade
10th Grade Comparison
Mongolians
Immigrants from Nigeria
94.0%
10TH GRADE
74.4/ 100
METRIC RATING
156th/ 347
METRIC RANK
92.7%
10TH GRADE
0.7/ 100
METRIC RATING
256th/ 347
METRIC RANK
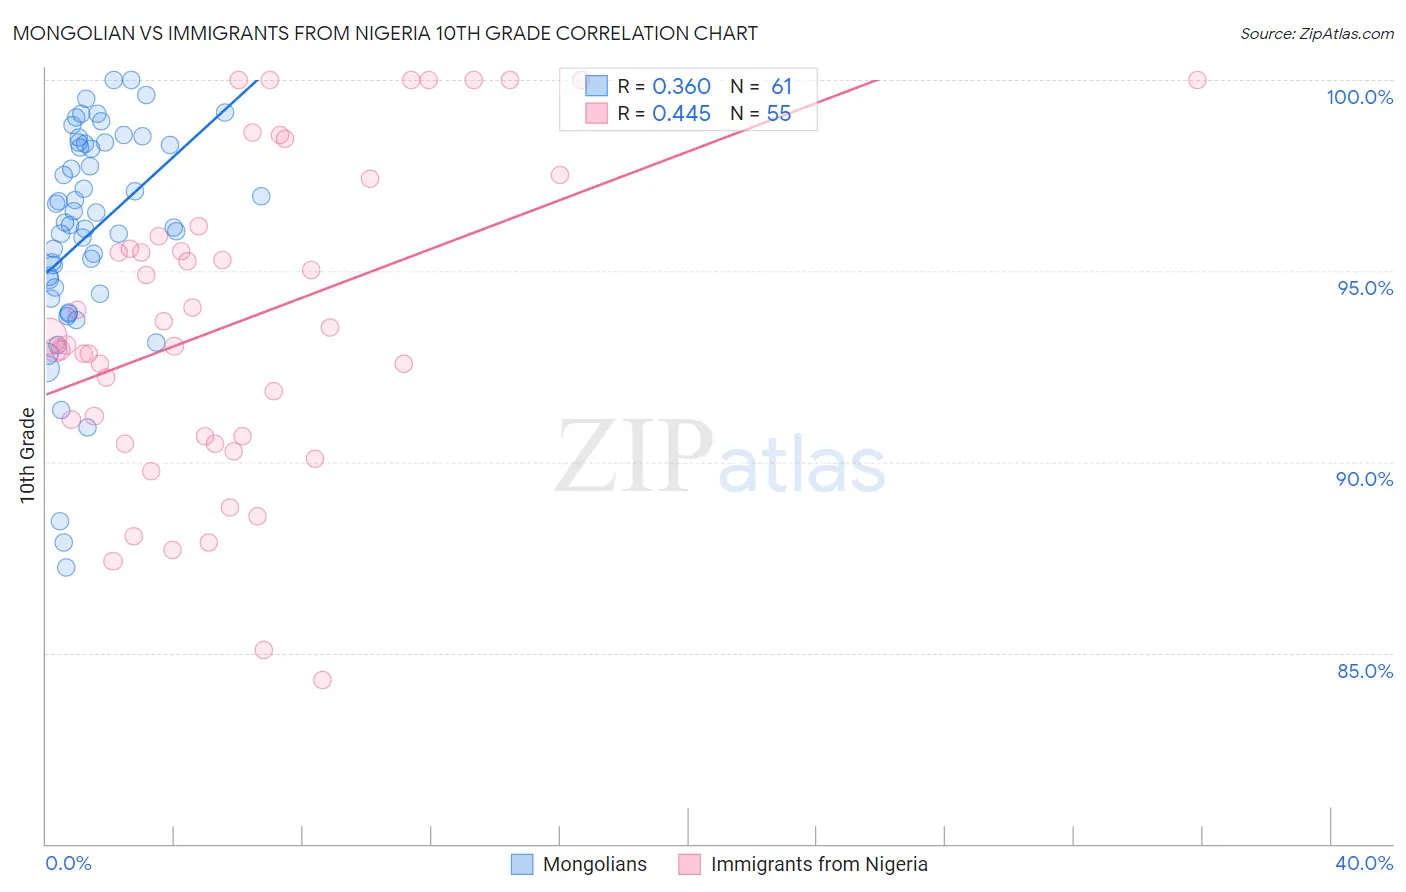
Mongolian vs Immigrants from Nigeria 10th Grade Correlation Chart
The statistical analysis conducted on geographies consisting of 140,362,004 people shows a mild positive correlation between the proportion of Mongolians and percentage of population with at least 10th grade education in the United States with a correlation coefficient (R) of 0.360 and weighted average of 94.0%. Similarly, the statistical analysis conducted on geographies consisting of 283,441,873 people shows a moderate positive correlation between the proportion of Immigrants from Nigeria and percentage of population with at least 10th grade education in the United States with a correlation coefficient (R) of 0.445 and weighted average of 92.7%, a difference of 1.4%.
10th Grade Correlation Summary
| Measurement | Mongolian | Immigrants from Nigeria |
| Minimum | 87.2% | 84.3% |
| Maximum | 100.0% | 100.0% |
| Range | 12.8% | 15.7% |
| Mean | 96.0% | 93.7% |
| Median | 96.3% | 93.3% |
| Interquartile 25% (IQ1) | 94.5% | 90.7% |
| Interquartile 75% (IQ3) | 98.3% | 96.2% |
| Interquartile Range (IQR) | 3.9% | 5.5% |
| Standard Deviation (Sample) | 2.9% | 4.1% |
| Standard Deviation (Population) | 2.9% | 4.1% |
Similar Demographics by 10th Grade
Demographics Similar to Mongolians by 10th Grade
In terms of 10th grade, the demographic groups most similar to Mongolians are Immigrants from Brazil (94.0%, a difference of 0.010%), Immigrants from Kenya (94.0%, a difference of 0.010%), Spanish (94.0%, a difference of 0.010%), Kiowa (93.9%, a difference of 0.010%), and Immigrants from Italy (94.0%, a difference of 0.040%).
| Demographics | Rating | Rank | 10th Grade |
| Ugandans | 80.7 /100 | #149 | Excellent 94.0% |
| Egyptians | 79.6 /100 | #150 | Good 94.0% |
| Kenyans | 79.1 /100 | #151 | Good 94.0% |
| Immigrants | Italy | 78.0 /100 | #152 | Good 94.0% |
| Immigrants | Brazil | 75.5 /100 | #153 | Good 94.0% |
| Immigrants | Kenya | 75.3 /100 | #154 | Good 94.0% |
| Spanish | 74.9 /100 | #155 | Good 94.0% |
| Mongolians | 74.4 /100 | #156 | Good 94.0% |
| Kiowa | 73.3 /100 | #157 | Good 93.9% |
| Bermudans | 71.0 /100 | #158 | Good 93.9% |
| Chileans | 70.2 /100 | #159 | Good 93.9% |
| Pakistanis | 70.1 /100 | #160 | Good 93.9% |
| Assyrians/Chaldeans/Syriacs | 69.7 /100 | #161 | Good 93.9% |
| Immigrants | Poland | 69.6 /100 | #162 | Good 93.9% |
| Venezuelans | 69.5 /100 | #163 | Good 93.9% |
Demographics Similar to Immigrants from Nigeria by 10th Grade
In terms of 10th grade, the demographic groups most similar to Immigrants from Nigeria are Immigrants from Bolivia (92.7%, a difference of 0.010%), U.S. Virgin Islander (92.7%, a difference of 0.010%), Immigrants from Costa Rica (92.7%, a difference of 0.020%), Armenian (92.7%, a difference of 0.060%), and Immigrants from Jamaica (92.6%, a difference of 0.060%).
| Demographics | Rating | Rank | 10th Grade |
| Immigrants | Senegal | 1.4 /100 | #249 | Tragic 92.8% |
| Jamaicans | 1.2 /100 | #250 | Tragic 92.8% |
| Immigrants | Thailand | 1.0 /100 | #251 | Tragic 92.8% |
| South Americans | 0.9 /100 | #252 | Tragic 92.8% |
| Ghanaians | 0.9 /100 | #253 | Tragic 92.8% |
| Armenians | 0.9 /100 | #254 | Tragic 92.7% |
| Immigrants | Bolivia | 0.7 /100 | #255 | Tragic 92.7% |
| Immigrants | Nigeria | 0.7 /100 | #256 | Tragic 92.7% |
| U.S. Virgin Islanders | 0.7 /100 | #257 | Tragic 92.7% |
| Immigrants | Costa Rica | 0.6 /100 | #258 | Tragic 92.7% |
| Immigrants | Jamaica | 0.5 /100 | #259 | Tragic 92.6% |
| Immigrants | Uzbekistan | 0.5 /100 | #260 | Tragic 92.6% |
| Paiute | 0.4 /100 | #261 | Tragic 92.6% |
| Immigrants | South America | 0.4 /100 | #262 | Tragic 92.6% |
| Apache | 0.4 /100 | #263 | Tragic 92.6% |