Guatemalan vs Immigrants from Japan Cognitive Disability
COMPARE
Guatemalan
Immigrants from Japan
Cognitive Disability
Cognitive Disability Comparison
Guatemalans
Immigrants from Japan
17.8%
COGNITIVE DISABILITY
2.1/ 100
METRIC RATING
231st/ 347
METRIC RANK
16.9%
COGNITIVE DISABILITY
96.2/ 100
METRIC RATING
117th/ 347
METRIC RANK
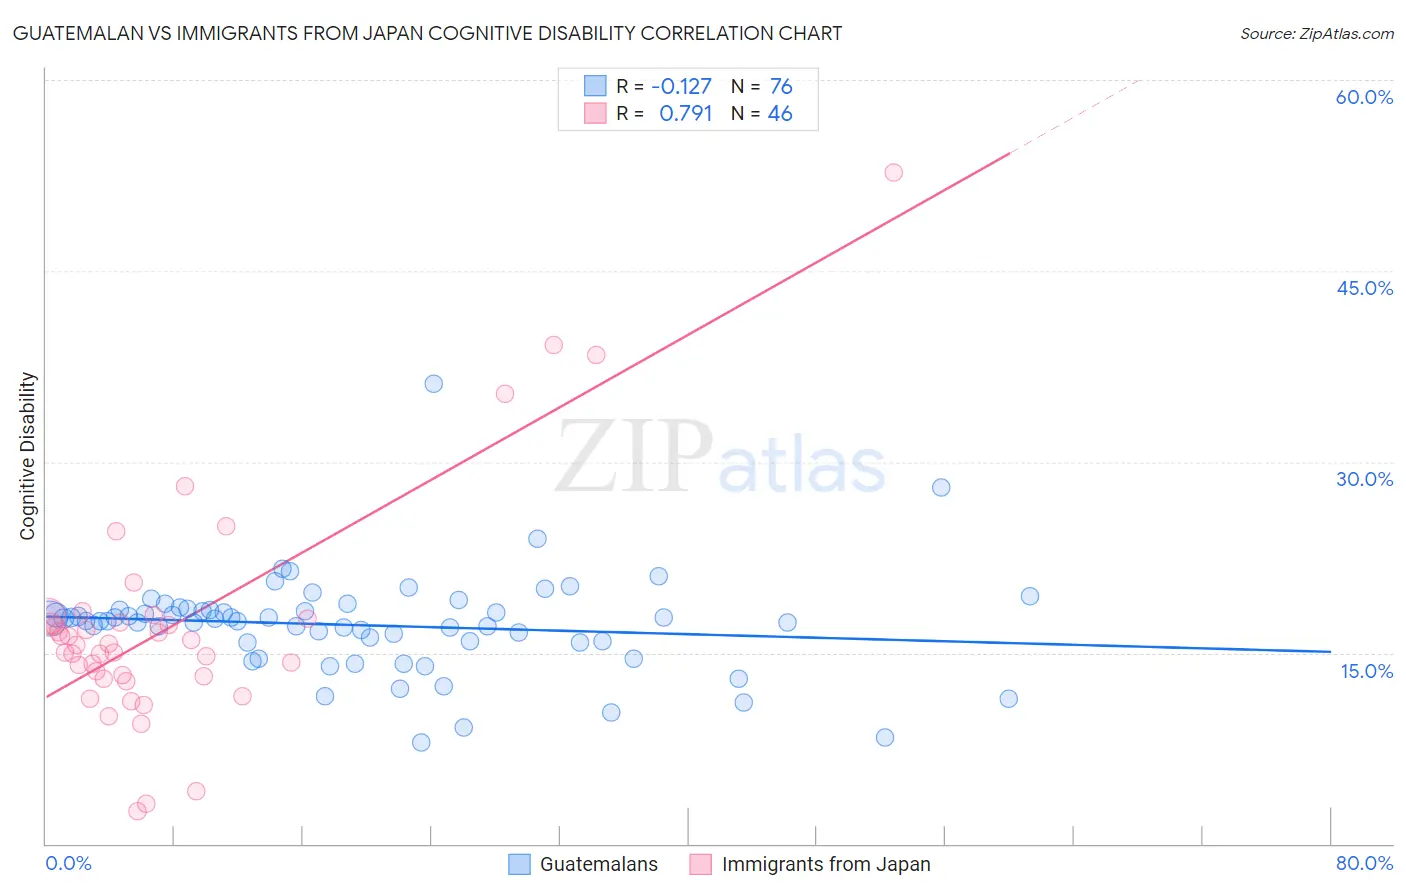
Guatemalan vs Immigrants from Japan Cognitive Disability Correlation Chart
The statistical analysis conducted on geographies consisting of 409,490,798 people shows a poor negative correlation between the proportion of Guatemalans and percentage of population with cognitive disability in the United States with a correlation coefficient (R) of -0.127 and weighted average of 17.8%. Similarly, the statistical analysis conducted on geographies consisting of 340,148,832 people shows a strong positive correlation between the proportion of Immigrants from Japan and percentage of population with cognitive disability in the United States with a correlation coefficient (R) of 0.791 and weighted average of 16.9%, a difference of 5.2%.
Cognitive Disability Correlation Summary
| Measurement | Guatemalan | Immigrants from Japan |
| Minimum | 7.9% | 2.6% |
| Maximum | 36.1% | 52.8% |
| Range | 28.2% | 50.2% |
| Mean | 17.2% | 17.2% |
| Median | 17.5% | 15.7% |
| Interquartile 25% (IQ1) | 15.9% | 13.1% |
| Interquartile 75% (IQ3) | 18.4% | 17.7% |
| Interquartile Range (IQR) | 2.5% | 4.6% |
| Standard Deviation (Sample) | 3.9% | 9.1% |
| Standard Deviation (Population) | 3.9% | 9.0% |
Similar Demographics by Cognitive Disability
Demographics Similar to Guatemalans by Cognitive Disability
In terms of cognitive disability, the demographic groups most similar to Guatemalans are Tongan (17.8%, a difference of 0.0%), Panamanian (17.8%, a difference of 0.0%), Osage (17.8%, a difference of 0.020%), Spanish American Indian (17.8%, a difference of 0.020%), and Mongolian (17.7%, a difference of 0.030%).
| Demographics | Rating | Rank | Cognitive Disability |
| Fijians | 3.4 /100 | #224 | Tragic 17.7% |
| Vietnamese | 3.4 /100 | #225 | Tragic 17.7% |
| Marshallese | 2.7 /100 | #226 | Tragic 17.7% |
| Immigrants | St. Vincent and the Grenadines | 2.6 /100 | #227 | Tragic 17.7% |
| Immigrants | Central America | 2.3 /100 | #228 | Tragic 17.7% |
| Immigrants | Guatemala | 2.2 /100 | #229 | Tragic 17.7% |
| Mongolians | 2.2 /100 | #230 | Tragic 17.7% |
| Guatemalans | 2.1 /100 | #231 | Tragic 17.8% |
| Tongans | 2.1 /100 | #232 | Tragic 17.8% |
| Panamanians | 2.1 /100 | #233 | Tragic 17.8% |
| Osage | 2.0 /100 | #234 | Tragic 17.8% |
| Spanish American Indians | 2.0 /100 | #235 | Tragic 17.8% |
| Immigrants | Iraq | 1.8 /100 | #236 | Tragic 17.8% |
| Immigrants | Mexico | 1.8 /100 | #237 | Tragic 17.8% |
| Cheyenne | 1.7 /100 | #238 | Tragic 17.8% |
Demographics Similar to Immigrants from Japan by Cognitive Disability
In terms of cognitive disability, the demographic groups most similar to Immigrants from Japan are Immigrants from Denmark (16.9%, a difference of 0.010%), Inupiat (16.9%, a difference of 0.050%), South African (16.9%, a difference of 0.13%), Yup'ik (16.9%, a difference of 0.15%), and Korean (16.8%, a difference of 0.20%).
| Demographics | Rating | Rank | Cognitive Disability |
| Arapaho | 97.3 /100 | #110 | Exceptional 16.8% |
| Uruguayans | 97.2 /100 | #111 | Exceptional 16.8% |
| Indians (Asian) | 97.2 /100 | #112 | Exceptional 16.8% |
| Immigrants | Sri Lanka | 97.1 /100 | #113 | Exceptional 16.8% |
| Koreans | 97.1 /100 | #114 | Exceptional 16.8% |
| Yup'ik | 96.9 /100 | #115 | Exceptional 16.9% |
| Inupiat | 96.5 /100 | #116 | Exceptional 16.9% |
| Immigrants | Japan | 96.2 /100 | #117 | Exceptional 16.9% |
| Immigrants | Denmark | 96.2 /100 | #118 | Exceptional 16.9% |
| South Africans | 95.5 /100 | #119 | Exceptional 16.9% |
| Scottish | 95.0 /100 | #120 | Exceptional 16.9% |
| Immigrants | China | 94.9 /100 | #121 | Exceptional 16.9% |
| Immigrants | Western Europe | 94.8 /100 | #122 | Exceptional 16.9% |
| Portuguese | 94.7 /100 | #123 | Exceptional 16.9% |
| Turks | 94.5 /100 | #124 | Exceptional 16.9% |