Danish vs Immigrants from Austria Cognitive Disability
COMPARE
Danish
Immigrants from Austria
Cognitive Disability
Cognitive Disability Comparison
Danes
Immigrants from Austria
16.7%
COGNITIVE DISABILITY
98.8/ 100
METRIC RATING
91st/ 347
METRIC RANK
16.3%
COGNITIVE DISABILITY
100.0/ 100
METRIC RATING
14th/ 347
METRIC RANK
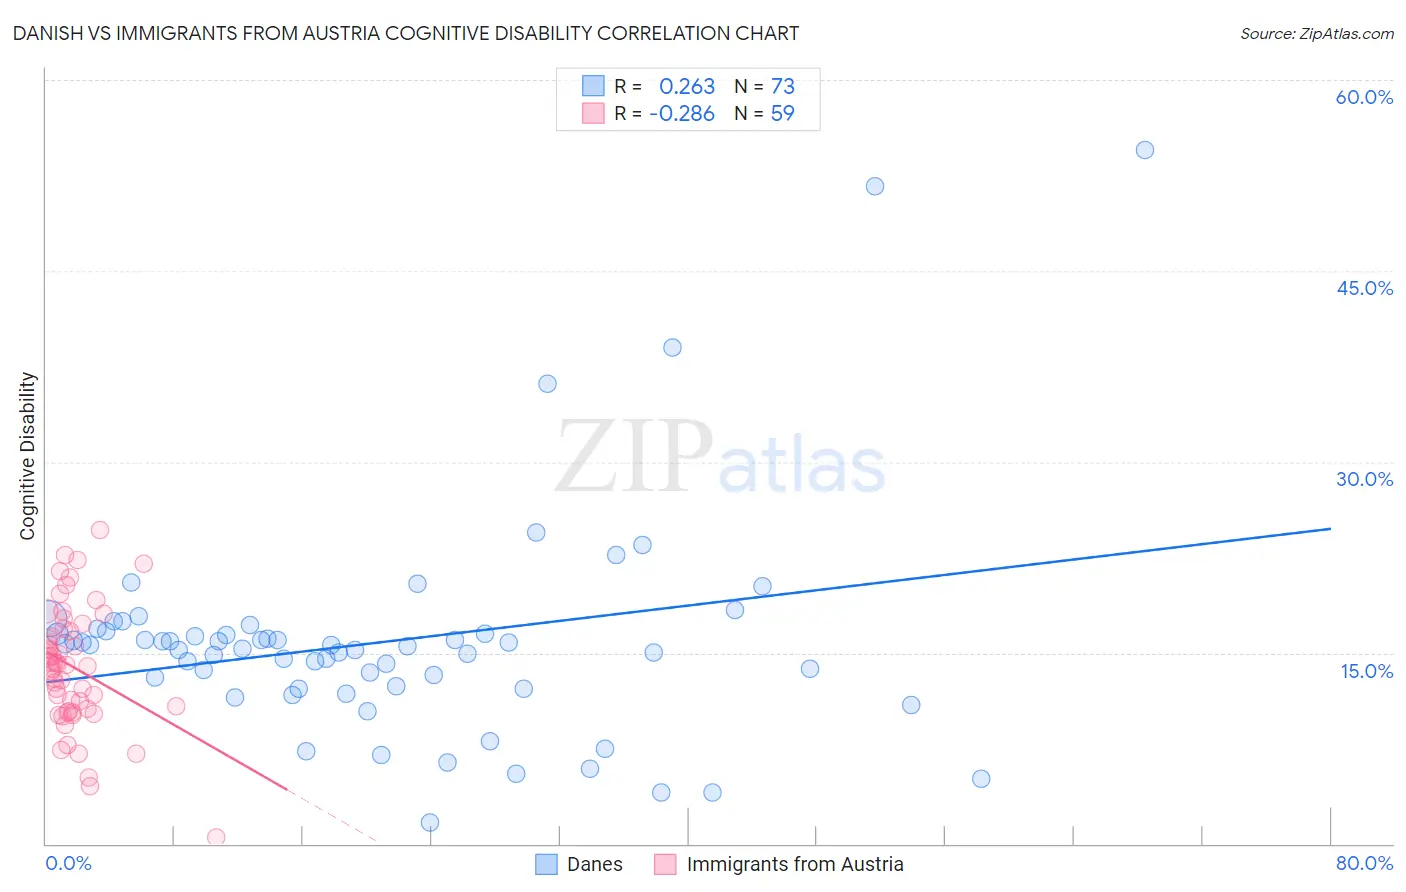
Danish vs Immigrants from Austria Cognitive Disability Correlation Chart
The statistical analysis conducted on geographies consisting of 474,128,115 people shows a weak positive correlation between the proportion of Danes and percentage of population with cognitive disability in the United States with a correlation coefficient (R) of 0.263 and weighted average of 16.7%. Similarly, the statistical analysis conducted on geographies consisting of 167,969,615 people shows a weak negative correlation between the proportion of Immigrants from Austria and percentage of population with cognitive disability in the United States with a correlation coefficient (R) of -0.286 and weighted average of 16.3%, a difference of 2.9%.
Cognitive Disability Correlation Summary
| Measurement | Danish | Immigrants from Austria |
| Minimum | 1.7% | 0.49% |
| Maximum | 54.5% | 24.6% |
| Range | 52.9% | 24.1% |
| Mean | 15.8% | 13.9% |
| Median | 15.5% | 14.1% |
| Interquartile 25% (IQ1) | 12.3% | 10.4% |
| Interquartile 75% (IQ3) | 16.6% | 16.9% |
| Interquartile Range (IQR) | 4.3% | 6.5% |
| Standard Deviation (Sample) | 8.6% | 4.8% |
| Standard Deviation (Population) | 8.6% | 4.8% |
Similar Demographics by Cognitive Disability
Demographics Similar to Danes by Cognitive Disability
In terms of cognitive disability, the demographic groups most similar to Danes are Immigrants from Egypt (16.7%, a difference of 0.010%), South American (16.7%, a difference of 0.010%), Immigrants from South America (16.7%, a difference of 0.010%), Immigrants from Southern Europe (16.7%, a difference of 0.020%), and Asian (16.7%, a difference of 0.060%).
| Demographics | Rating | Rank | Cognitive Disability |
| Belgians | 99.1 /100 | #84 | Exceptional 16.7% |
| Immigrants | Moldova | 99.1 /100 | #85 | Exceptional 16.7% |
| Immigrants | South Africa | 99.0 /100 | #86 | Exceptional 16.7% |
| Native Hawaiians | 99.0 /100 | #87 | Exceptional 16.7% |
| Immigrants | Philippines | 99.0 /100 | #88 | Exceptional 16.7% |
| Immigrants | Egypt | 98.8 /100 | #89 | Exceptional 16.7% |
| South Americans | 98.8 /100 | #90 | Exceptional 16.7% |
| Danes | 98.8 /100 | #91 | Exceptional 16.7% |
| Immigrants | South America | 98.8 /100 | #92 | Exceptional 16.7% |
| Immigrants | Southern Europe | 98.7 /100 | #93 | Exceptional 16.7% |
| Asians | 98.7 /100 | #94 | Exceptional 16.7% |
| English | 98.6 /100 | #95 | Exceptional 16.8% |
| Finns | 98.5 /100 | #96 | Exceptional 16.8% |
| Dutch | 98.5 /100 | #97 | Exceptional 16.8% |
| Immigrants | Lebanon | 98.4 /100 | #98 | Exceptional 16.8% |
Demographics Similar to Immigrants from Austria by Cognitive Disability
In terms of cognitive disability, the demographic groups most similar to Immigrants from Austria are Immigrants from Greece (16.3%, a difference of 0.030%), Lithuanian (16.3%, a difference of 0.060%), Maltese (16.2%, a difference of 0.15%), Immigrants from Czechoslovakia (16.2%, a difference of 0.31%), and Eastern European (16.3%, a difference of 0.33%).
| Demographics | Rating | Rank | Cognitive Disability |
| Immigrants | Ireland | 100.0 /100 | #7 | Exceptional 16.1% |
| Immigrants | Poland | 100.0 /100 | #8 | Exceptional 16.1% |
| Assyrians/Chaldeans/Syriacs | 100.0 /100 | #9 | Exceptional 16.2% |
| Immigrants | Scotland | 100.0 /100 | #10 | Exceptional 16.2% |
| Immigrants | Czechoslovakia | 100.0 /100 | #11 | Exceptional 16.2% |
| Maltese | 100.0 /100 | #12 | Exceptional 16.2% |
| Lithuanians | 100.0 /100 | #13 | Exceptional 16.3% |
| Immigrants | Austria | 100.0 /100 | #14 | Exceptional 16.3% |
| Immigrants | Greece | 100.0 /100 | #15 | Exceptional 16.3% |
| Eastern Europeans | 100.0 /100 | #16 | Exceptional 16.3% |
| Immigrants | North Macedonia | 100.0 /100 | #17 | Exceptional 16.3% |
| Immigrants | Northern Europe | 100.0 /100 | #18 | Exceptional 16.3% |
| Immigrants | Bolivia | 100.0 /100 | #19 | Exceptional 16.3% |
| Bulgarians | 100.0 /100 | #20 | Exceptional 16.3% |
| Immigrants | Cuba | 100.0 /100 | #21 | Exceptional 16.3% |