Ethiopian vs Immigrants from Austria Cognitive Disability
COMPARE
Ethiopian
Immigrants from Austria
Cognitive Disability
Cognitive Disability Comparison
Ethiopians
Immigrants from Austria
17.9%
COGNITIVE DISABILITY
0.5/ 100
METRIC RATING
259th/ 347
METRIC RANK
16.3%
COGNITIVE DISABILITY
100.0/ 100
METRIC RATING
14th/ 347
METRIC RANK
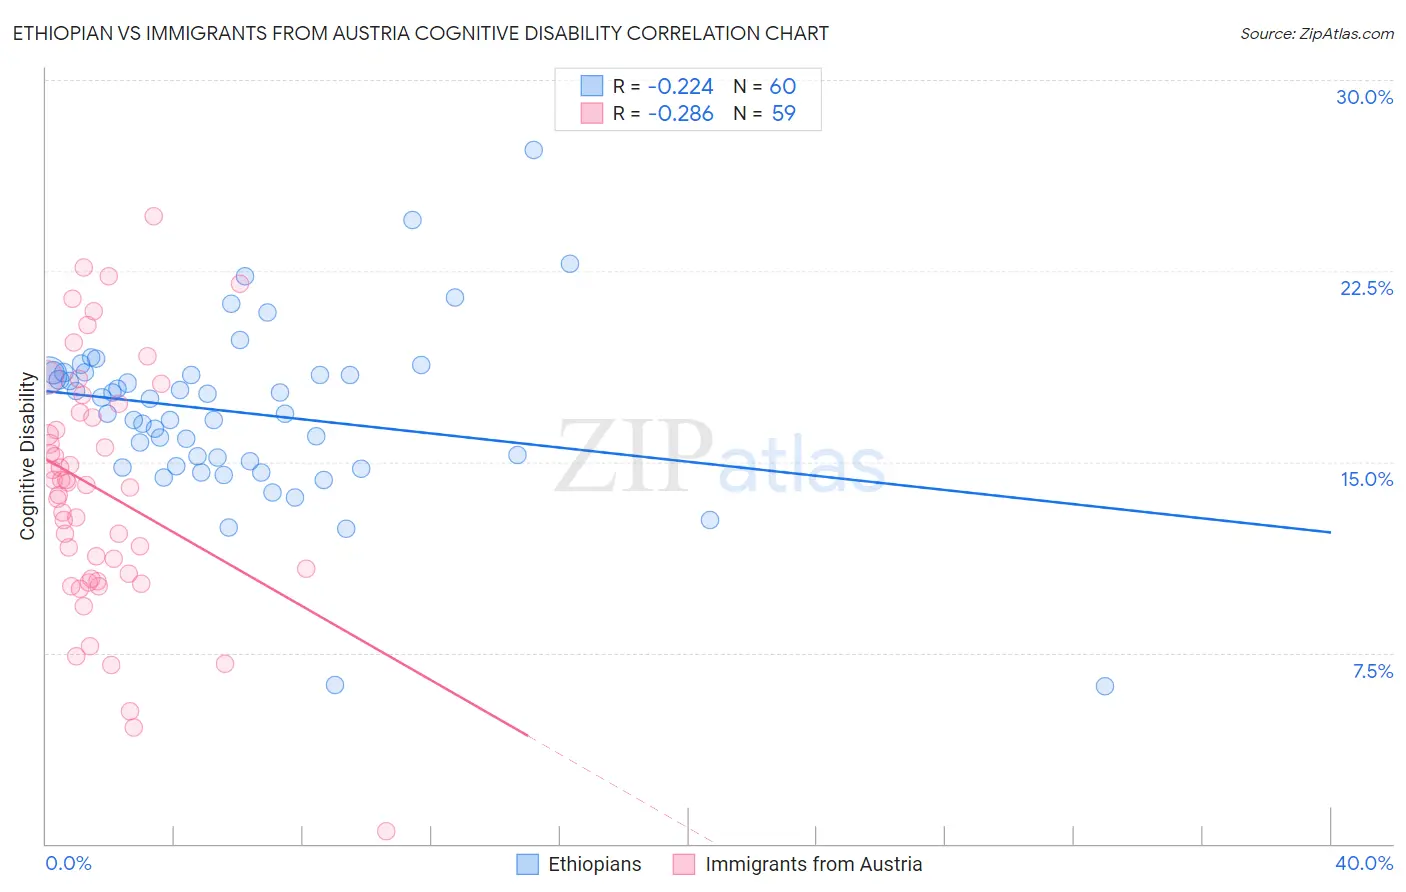
Ethiopian vs Immigrants from Austria Cognitive Disability Correlation Chart
The statistical analysis conducted on geographies consisting of 223,243,402 people shows a weak negative correlation between the proportion of Ethiopians and percentage of population with cognitive disability in the United States with a correlation coefficient (R) of -0.224 and weighted average of 17.9%. Similarly, the statistical analysis conducted on geographies consisting of 167,969,615 people shows a weak negative correlation between the proportion of Immigrants from Austria and percentage of population with cognitive disability in the United States with a correlation coefficient (R) of -0.286 and weighted average of 16.3%, a difference of 10.2%.
Cognitive Disability Correlation Summary
| Measurement | Ethiopian | Immigrants from Austria |
| Minimum | 6.2% | 0.49% |
| Maximum | 27.2% | 24.6% |
| Range | 21.1% | 24.1% |
| Mean | 16.9% | 13.9% |
| Median | 17.2% | 14.1% |
| Interquartile 25% (IQ1) | 14.9% | 10.4% |
| Interquartile 75% (IQ3) | 18.5% | 16.9% |
| Interquartile Range (IQR) | 3.6% | 6.5% |
| Standard Deviation (Sample) | 3.5% | 4.8% |
| Standard Deviation (Population) | 3.4% | 4.8% |
Similar Demographics by Cognitive Disability
Demographics Similar to Ethiopians by Cognitive Disability
In terms of cognitive disability, the demographic groups most similar to Ethiopians are Immigrants from Belize (17.9%, a difference of 0.010%), Guamanian/Chamorro (17.9%, a difference of 0.060%), Immigrants from Armenia (17.9%, a difference of 0.080%), Mexican American Indian (17.9%, a difference of 0.090%), and Sierra Leonean (17.9%, a difference of 0.090%).
| Demographics | Rating | Rank | Cognitive Disability |
| Immigrants | Grenada | 0.6 /100 | #252 | Tragic 17.9% |
| Hopi | 0.6 /100 | #253 | Tragic 17.9% |
| Hispanics or Latinos | 0.6 /100 | #254 | Tragic 17.9% |
| Immigrants | Azores | 0.6 /100 | #255 | Tragic 17.9% |
| Bahamians | 0.6 /100 | #256 | Tragic 17.9% |
| Mexican American Indians | 0.6 /100 | #257 | Tragic 17.9% |
| Immigrants | Armenia | 0.6 /100 | #258 | Tragic 17.9% |
| Ethiopians | 0.5 /100 | #259 | Tragic 17.9% |
| Immigrants | Belize | 0.5 /100 | #260 | Tragic 17.9% |
| Guamanians/Chamorros | 0.5 /100 | #261 | Tragic 17.9% |
| Sierra Leoneans | 0.4 /100 | #262 | Tragic 17.9% |
| Immigrants | Barbados | 0.4 /100 | #263 | Tragic 17.9% |
| Menominee | 0.4 /100 | #264 | Tragic 18.0% |
| Spanish Americans | 0.4 /100 | #265 | Tragic 18.0% |
| Belizeans | 0.4 /100 | #266 | Tragic 18.0% |
Demographics Similar to Immigrants from Austria by Cognitive Disability
In terms of cognitive disability, the demographic groups most similar to Immigrants from Austria are Immigrants from Greece (16.3%, a difference of 0.030%), Lithuanian (16.3%, a difference of 0.060%), Maltese (16.2%, a difference of 0.15%), Immigrants from Czechoslovakia (16.2%, a difference of 0.31%), and Eastern European (16.3%, a difference of 0.33%).
| Demographics | Rating | Rank | Cognitive Disability |
| Immigrants | Ireland | 100.0 /100 | #7 | Exceptional 16.1% |
| Immigrants | Poland | 100.0 /100 | #8 | Exceptional 16.1% |
| Assyrians/Chaldeans/Syriacs | 100.0 /100 | #9 | Exceptional 16.2% |
| Immigrants | Scotland | 100.0 /100 | #10 | Exceptional 16.2% |
| Immigrants | Czechoslovakia | 100.0 /100 | #11 | Exceptional 16.2% |
| Maltese | 100.0 /100 | #12 | Exceptional 16.2% |
| Lithuanians | 100.0 /100 | #13 | Exceptional 16.3% |
| Immigrants | Austria | 100.0 /100 | #14 | Exceptional 16.3% |
| Immigrants | Greece | 100.0 /100 | #15 | Exceptional 16.3% |
| Eastern Europeans | 100.0 /100 | #16 | Exceptional 16.3% |
| Immigrants | North Macedonia | 100.0 /100 | #17 | Exceptional 16.3% |
| Immigrants | Northern Europe | 100.0 /100 | #18 | Exceptional 16.3% |
| Immigrants | Bolivia | 100.0 /100 | #19 | Exceptional 16.3% |
| Bulgarians | 100.0 /100 | #20 | Exceptional 16.3% |
| Immigrants | Cuba | 100.0 /100 | #21 | Exceptional 16.3% |