Immigrants from Kuwait vs Dutch West Indian Cognitive Disability
COMPARE
Immigrants from Kuwait
Dutch West Indian
Cognitive Disability
Cognitive Disability Comparison
Immigrants from Kuwait
Dutch West Indians
18.1%
COGNITIVE DISABILITY
0.2/ 100
METRIC RATING
277th/ 347
METRIC RANK
18.1%
COGNITIVE DISABILITY
0.1/ 100
METRIC RATING
287th/ 347
METRIC RANK
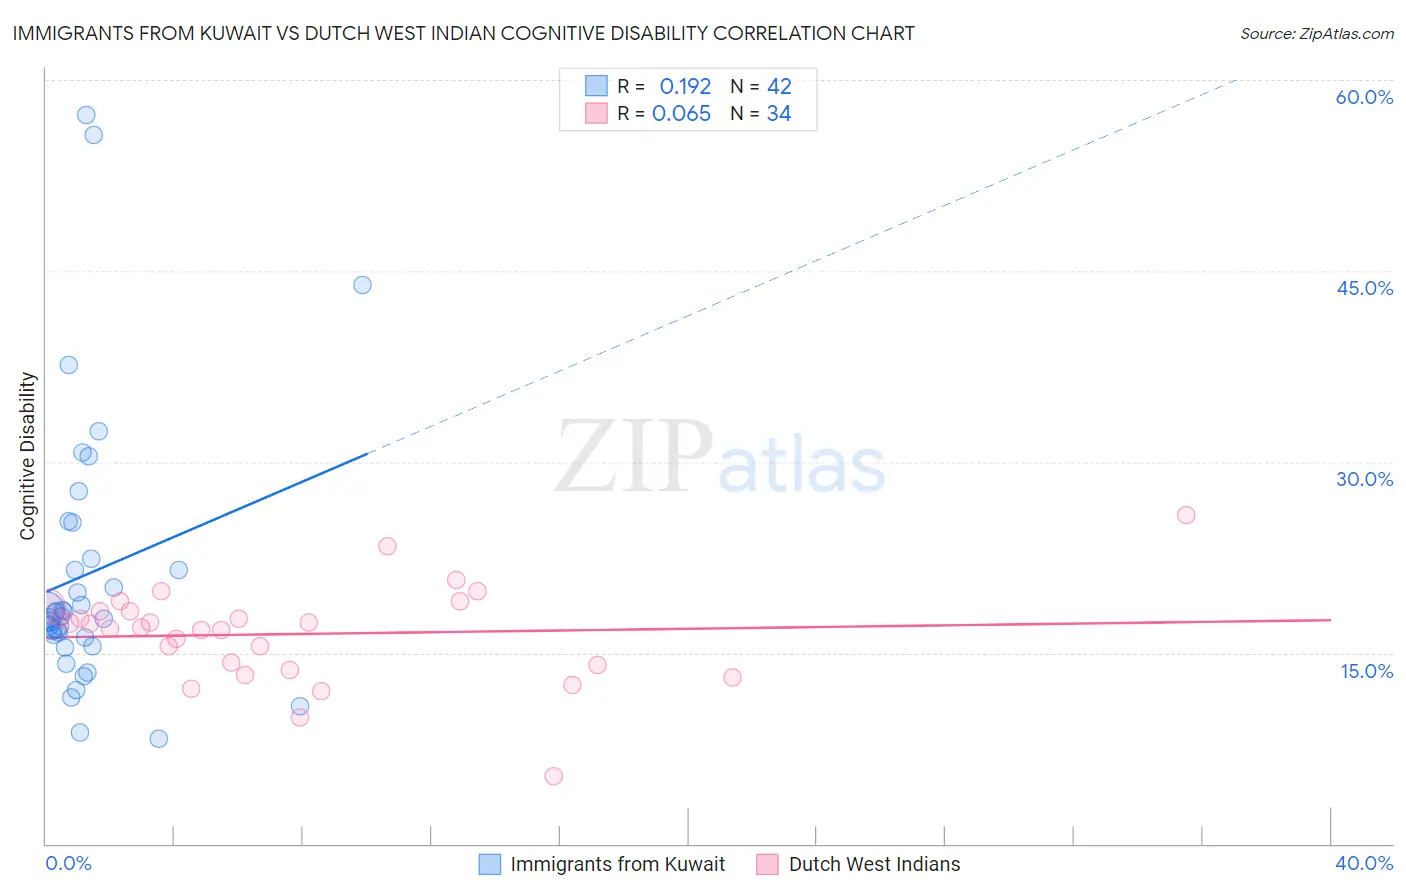
Immigrants from Kuwait vs Dutch West Indian Cognitive Disability Correlation Chart
The statistical analysis conducted on geographies consisting of 136,916,630 people shows a poor positive correlation between the proportion of Immigrants from Kuwait and percentage of population with cognitive disability in the United States with a correlation coefficient (R) of 0.192 and weighted average of 18.1%. Similarly, the statistical analysis conducted on geographies consisting of 85,769,565 people shows a slight positive correlation between the proportion of Dutch West Indians and percentage of population with cognitive disability in the United States with a correlation coefficient (R) of 0.065 and weighted average of 18.1%, a difference of 0.36%.
Cognitive Disability Correlation Summary
| Measurement | Immigrants from Kuwait | Dutch West Indian |
| Minimum | 8.3% | 5.3% |
| Maximum | 57.2% | 25.8% |
| Range | 49.0% | 20.5% |
| Mean | 21.2% | 16.5% |
| Median | 18.0% | 17.1% |
| Interquartile 25% (IQ1) | 16.2% | 14.0% |
| Interquartile 75% (IQ3) | 22.4% | 18.3% |
| Interquartile Range (IQR) | 6.3% | 4.2% |
| Standard Deviation (Sample) | 10.8% | 3.8% |
| Standard Deviation (Population) | 10.6% | 3.7% |
Demographics Similar to Immigrants from Kuwait and Dutch West Indians by Cognitive Disability
In terms of cognitive disability, the demographic groups most similar to Immigrants from Kuwait are Yuman (18.1%, a difference of 0.0%), Immigrants from Micronesia (18.1%, a difference of 0.010%), Immigrants from Laos (18.1%, a difference of 0.050%), Chippewa (18.1%, a difference of 0.060%), and West Indian (18.1%, a difference of 0.070%). Similarly, the demographic groups most similar to Dutch West Indians are Immigrants from West Indies (18.1%, a difference of 0.010%), Native/Alaskan (18.1%, a difference of 0.020%), Kenyan (18.1%, a difference of 0.040%), Immigrants from Africa (18.1%, a difference of 0.050%), and Bermudan (18.1%, a difference of 0.080%).
| Demographics | Rating | Rank | Cognitive Disability |
| Immigrants | Honduras | 0.2 /100 | #272 | Tragic 18.0% |
| Immigrants | Nepal | 0.2 /100 | #273 | Tragic 18.0% |
| Immigrants | Nigeria | 0.2 /100 | #274 | Tragic 18.0% |
| Immigrants | Laos | 0.2 /100 | #275 | Tragic 18.1% |
| Yuman | 0.2 /100 | #276 | Tragic 18.1% |
| Immigrants | Kuwait | 0.2 /100 | #277 | Tragic 18.1% |
| Immigrants | Micronesia | 0.2 /100 | #278 | Tragic 18.1% |
| Chippewa | 0.1 /100 | #279 | Tragic 18.1% |
| West Indians | 0.1 /100 | #280 | Tragic 18.1% |
| Yakama | 0.1 /100 | #281 | Tragic 18.1% |
| Immigrants | Cambodia | 0.1 /100 | #282 | Tragic 18.1% |
| Nigerians | 0.1 /100 | #283 | Tragic 18.1% |
| Immigrants | Uganda | 0.1 /100 | #284 | Tragic 18.1% |
| Bermudans | 0.1 /100 | #285 | Tragic 18.1% |
| Kenyans | 0.1 /100 | #286 | Tragic 18.1% |
| Dutch West Indians | 0.1 /100 | #287 | Tragic 18.1% |
| Immigrants | West Indies | 0.1 /100 | #288 | Tragic 18.1% |
| Natives/Alaskans | 0.1 /100 | #289 | Tragic 18.1% |
| Immigrants | Africa | 0.1 /100 | #290 | Tragic 18.1% |
| Ottawa | 0.1 /100 | #291 | Tragic 18.2% |
| Iroquois | 0.1 /100 | #292 | Tragic 18.2% |