Immigrants from Austria vs Dutch West Indian Cognitive Disability
COMPARE
Immigrants from Austria
Dutch West Indian
Cognitive Disability
Cognitive Disability Comparison
Immigrants from Austria
Dutch West Indians
16.3%
COGNITIVE DISABILITY
100.0/ 100
METRIC RATING
14th/ 347
METRIC RANK
18.1%
COGNITIVE DISABILITY
0.1/ 100
METRIC RATING
287th/ 347
METRIC RANK
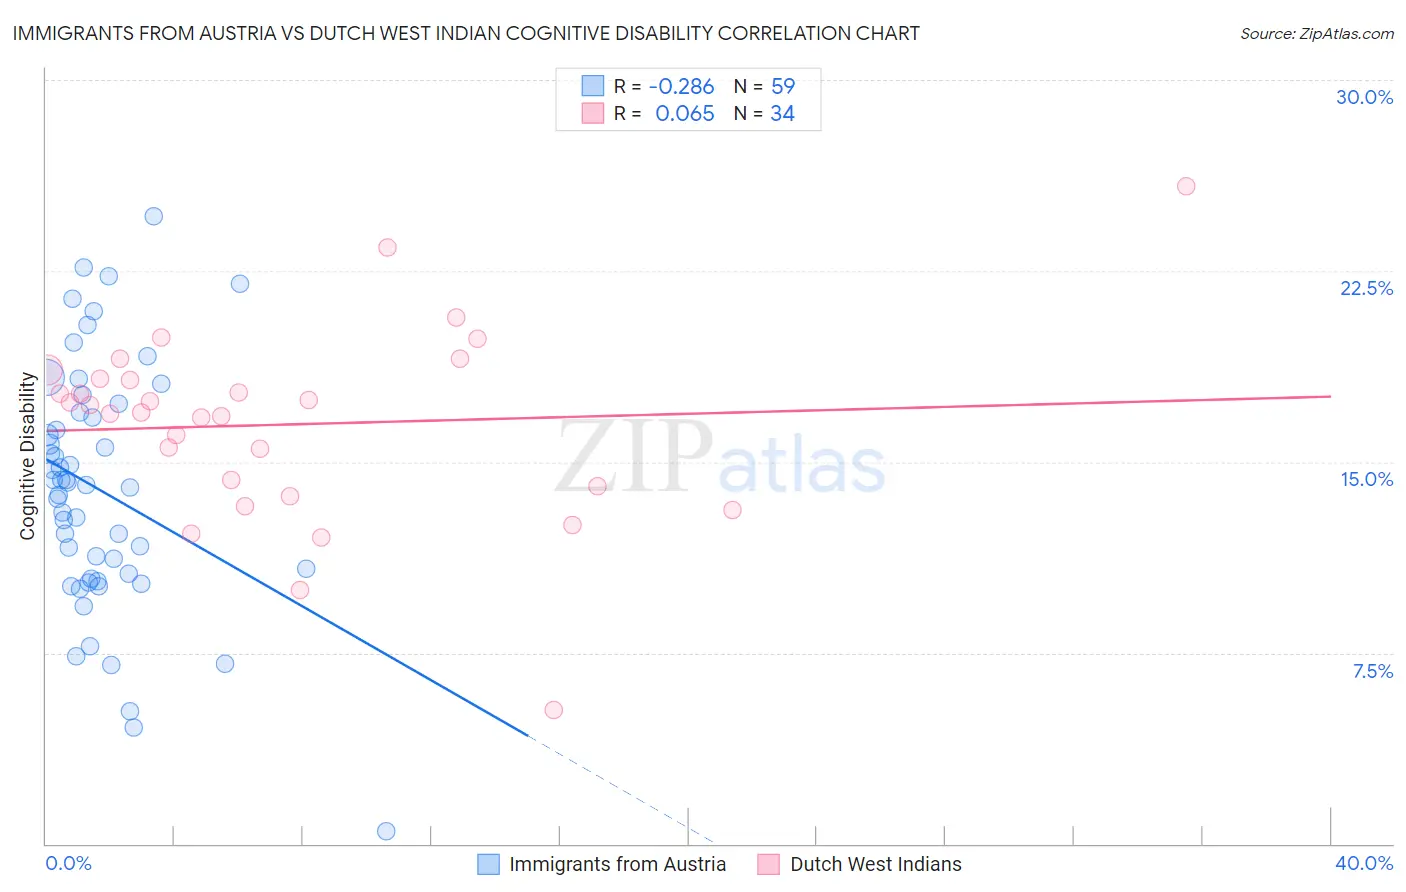
Immigrants from Austria vs Dutch West Indian Cognitive Disability Correlation Chart
The statistical analysis conducted on geographies consisting of 167,969,615 people shows a weak negative correlation between the proportion of Immigrants from Austria and percentage of population with cognitive disability in the United States with a correlation coefficient (R) of -0.286 and weighted average of 16.3%. Similarly, the statistical analysis conducted on geographies consisting of 85,769,565 people shows a slight positive correlation between the proportion of Dutch West Indians and percentage of population with cognitive disability in the United States with a correlation coefficient (R) of 0.065 and weighted average of 18.1%, a difference of 11.5%.
Cognitive Disability Correlation Summary
| Measurement | Immigrants from Austria | Dutch West Indian |
| Minimum | 0.49% | 5.3% |
| Maximum | 24.6% | 25.8% |
| Range | 24.1% | 20.5% |
| Mean | 13.9% | 16.5% |
| Median | 14.1% | 17.1% |
| Interquartile 25% (IQ1) | 10.4% | 14.0% |
| Interquartile 75% (IQ3) | 16.9% | 18.3% |
| Interquartile Range (IQR) | 6.5% | 4.2% |
| Standard Deviation (Sample) | 4.8% | 3.8% |
| Standard Deviation (Population) | 4.8% | 3.7% |
Similar Demographics by Cognitive Disability
Demographics Similar to Immigrants from Austria by Cognitive Disability
In terms of cognitive disability, the demographic groups most similar to Immigrants from Austria are Immigrants from Greece (16.3%, a difference of 0.030%), Lithuanian (16.3%, a difference of 0.060%), Maltese (16.2%, a difference of 0.15%), Immigrants from Czechoslovakia (16.2%, a difference of 0.31%), and Eastern European (16.3%, a difference of 0.33%).
| Demographics | Rating | Rank | Cognitive Disability |
| Immigrants | Ireland | 100.0 /100 | #7 | Exceptional 16.1% |
| Immigrants | Poland | 100.0 /100 | #8 | Exceptional 16.1% |
| Assyrians/Chaldeans/Syriacs | 100.0 /100 | #9 | Exceptional 16.2% |
| Immigrants | Scotland | 100.0 /100 | #10 | Exceptional 16.2% |
| Immigrants | Czechoslovakia | 100.0 /100 | #11 | Exceptional 16.2% |
| Maltese | 100.0 /100 | #12 | Exceptional 16.2% |
| Lithuanians | 100.0 /100 | #13 | Exceptional 16.3% |
| Immigrants | Austria | 100.0 /100 | #14 | Exceptional 16.3% |
| Immigrants | Greece | 100.0 /100 | #15 | Exceptional 16.3% |
| Eastern Europeans | 100.0 /100 | #16 | Exceptional 16.3% |
| Immigrants | North Macedonia | 100.0 /100 | #17 | Exceptional 16.3% |
| Immigrants | Northern Europe | 100.0 /100 | #18 | Exceptional 16.3% |
| Immigrants | Bolivia | 100.0 /100 | #19 | Exceptional 16.3% |
| Bulgarians | 100.0 /100 | #20 | Exceptional 16.3% |
| Immigrants | Cuba | 100.0 /100 | #21 | Exceptional 16.3% |
Demographics Similar to Dutch West Indians by Cognitive Disability
In terms of cognitive disability, the demographic groups most similar to Dutch West Indians are Immigrants from West Indies (18.1%, a difference of 0.010%), Native/Alaskan (18.1%, a difference of 0.020%), Kenyan (18.1%, a difference of 0.040%), Immigrants from Africa (18.1%, a difference of 0.050%), and Bermudan (18.1%, a difference of 0.080%).
| Demographics | Rating | Rank | Cognitive Disability |
| West Indians | 0.1 /100 | #280 | Tragic 18.1% |
| Yakama | 0.1 /100 | #281 | Tragic 18.1% |
| Immigrants | Cambodia | 0.1 /100 | #282 | Tragic 18.1% |
| Nigerians | 0.1 /100 | #283 | Tragic 18.1% |
| Immigrants | Uganda | 0.1 /100 | #284 | Tragic 18.1% |
| Bermudans | 0.1 /100 | #285 | Tragic 18.1% |
| Kenyans | 0.1 /100 | #286 | Tragic 18.1% |
| Dutch West Indians | 0.1 /100 | #287 | Tragic 18.1% |
| Immigrants | West Indies | 0.1 /100 | #288 | Tragic 18.1% |
| Natives/Alaskans | 0.1 /100 | #289 | Tragic 18.1% |
| Immigrants | Africa | 0.1 /100 | #290 | Tragic 18.1% |
| Ottawa | 0.1 /100 | #291 | Tragic 18.2% |
| Iroquois | 0.1 /100 | #292 | Tragic 18.2% |
| Central American Indians | 0.1 /100 | #293 | Tragic 18.2% |
| British West Indians | 0.1 /100 | #294 | Tragic 18.2% |