Mexican American Indian vs German Russian Bachelor's Degree
COMPARE
Mexican American Indian
German Russian
Bachelor's Degree
Bachelor's Degree Comparison
Mexican American Indians
German Russians
30.2%
BACHELOR'S DEGREE
0.0/ 100
METRIC RATING
302nd/ 347
METRIC RANK
35.8%
BACHELOR'S DEGREE
10.2/ 100
METRIC RATING
217th/ 347
METRIC RANK
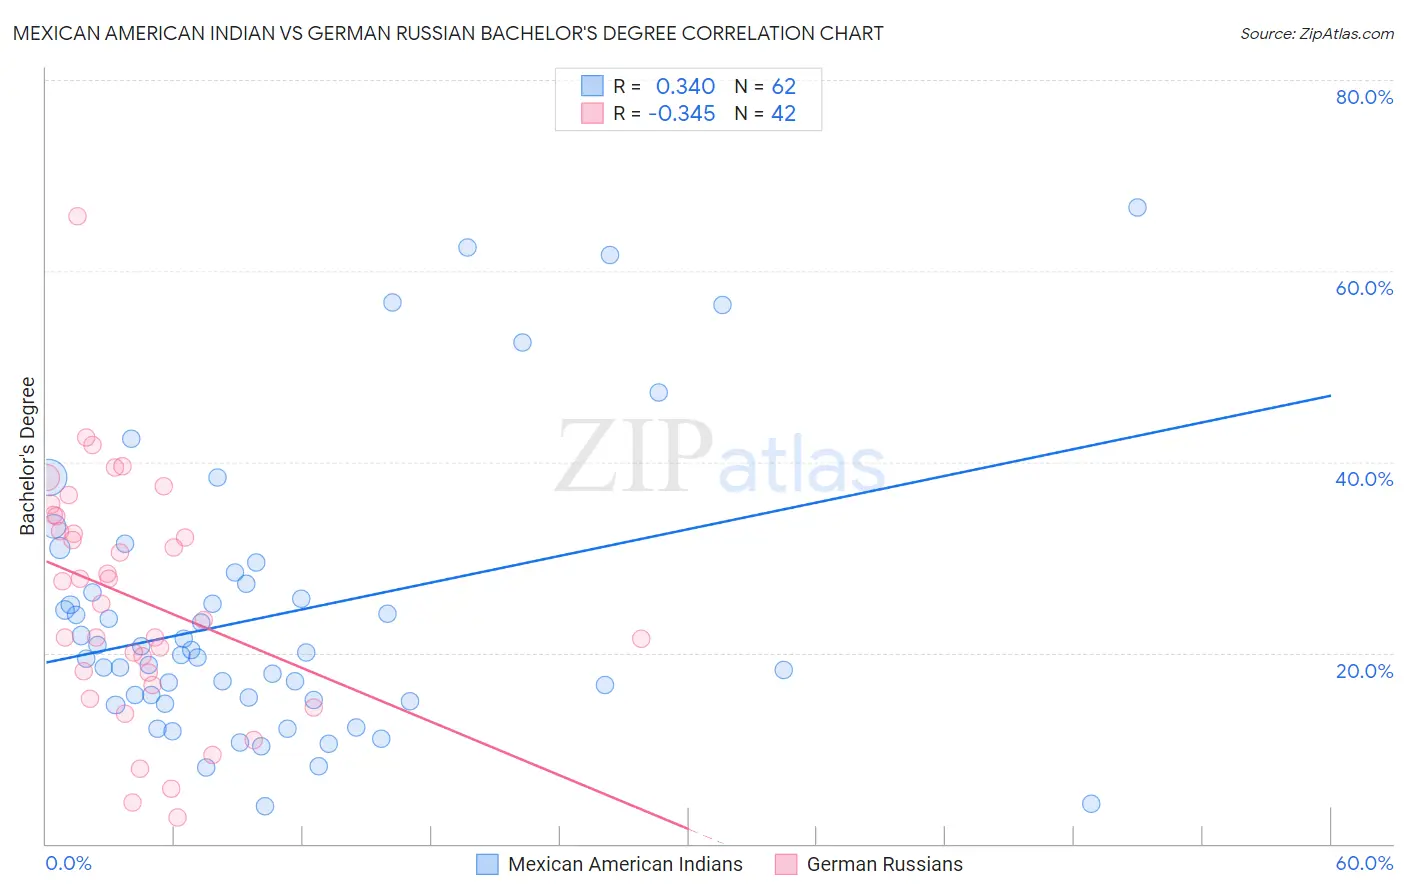
Mexican American Indian vs German Russian Bachelor's Degree Correlation Chart
The statistical analysis conducted on geographies consisting of 317,609,381 people shows a mild positive correlation between the proportion of Mexican American Indians and percentage of population with at least bachelor's degree education in the United States with a correlation coefficient (R) of 0.340 and weighted average of 30.2%. Similarly, the statistical analysis conducted on geographies consisting of 96,460,010 people shows a mild negative correlation between the proportion of German Russians and percentage of population with at least bachelor's degree education in the United States with a correlation coefficient (R) of -0.345 and weighted average of 35.8%, a difference of 18.5%.
Bachelor's Degree Correlation Summary
| Measurement | Mexican American Indian | German Russian |
| Minimum | 3.9% | 2.8% |
| Maximum | 66.7% | 65.8% |
| Range | 62.8% | 63.0% |
| Mean | 24.0% | 25.7% |
| Median | 19.9% | 26.4% |
| Interquartile 25% (IQ1) | 15.0% | 18.0% |
| Interquartile 75% (IQ3) | 27.2% | 34.3% |
| Interquartile Range (IQR) | 12.2% | 16.3% |
| Standard Deviation (Sample) | 14.5% | 12.5% |
| Standard Deviation (Population) | 14.4% | 12.3% |
Similar Demographics by Bachelor's Degree
Demographics Similar to Mexican American Indians by Bachelor's Degree
In terms of bachelor's degree, the demographic groups most similar to Mexican American Indians are Bangladeshi (30.2%, a difference of 0.17%), Cherokee (30.2%, a difference of 0.17%), Immigrants from Cuba (30.3%, a difference of 0.28%), Immigrants from Micronesia (30.4%, a difference of 0.49%), and Chickasaw (30.4%, a difference of 0.51%).
| Demographics | Rating | Rank | Bachelor's Degree |
| Immigrants | Dominican Republic | 0.0 /100 | #295 | Tragic 30.7% |
| Puget Sound Salish | 0.0 /100 | #296 | Tragic 30.7% |
| Immigrants | Haiti | 0.0 /100 | #297 | Tragic 30.6% |
| Chippewa | 0.0 /100 | #298 | Tragic 30.6% |
| Chickasaw | 0.0 /100 | #299 | Tragic 30.4% |
| Immigrants | Micronesia | 0.0 /100 | #300 | Tragic 30.4% |
| Immigrants | Cuba | 0.0 /100 | #301 | Tragic 30.3% |
| Mexican American Indians | 0.0 /100 | #302 | Tragic 30.2% |
| Bangladeshis | 0.0 /100 | #303 | Tragic 30.2% |
| Cherokee | 0.0 /100 | #304 | Tragic 30.2% |
| Immigrants | Latin America | 0.0 /100 | #305 | Tragic 30.1% |
| Immigrants | Yemen | 0.0 /100 | #306 | Tragic 29.9% |
| Nepalese | 0.0 /100 | #307 | Tragic 29.9% |
| Cajuns | 0.0 /100 | #308 | Tragic 29.6% |
| Hispanics or Latinos | 0.0 /100 | #309 | Tragic 29.6% |
Demographics Similar to German Russians by Bachelor's Degree
In terms of bachelor's degree, the demographic groups most similar to German Russians are Subsaharan African (35.8%, a difference of 0.10%), West Indian (35.8%, a difference of 0.13%), Spanish (35.8%, a difference of 0.17%), Dutch (35.7%, a difference of 0.28%), and Trinidadian and Tobagonian (35.7%, a difference of 0.42%).
| Demographics | Rating | Rank | Bachelor's Degree |
| French | 18.6 /100 | #210 | Poor 36.5% |
| Scotch-Irish | 18.3 /100 | #211 | Poor 36.4% |
| Immigrants | Philippines | 17.8 /100 | #212 | Poor 36.4% |
| Immigrants | Panama | 14.2 /100 | #213 | Poor 36.2% |
| Germans | 13.9 /100 | #214 | Poor 36.1% |
| Immigrants | Western Africa | 13.8 /100 | #215 | Poor 36.1% |
| Barbadians | 13.5 /100 | #216 | Poor 36.1% |
| German Russians | 10.2 /100 | #217 | Poor 35.8% |
| Sub-Saharan Africans | 9.8 /100 | #218 | Tragic 35.8% |
| West Indians | 9.7 /100 | #219 | Tragic 35.8% |
| Spanish | 9.6 /100 | #220 | Tragic 35.8% |
| Dutch | 9.2 /100 | #221 | Tragic 35.7% |
| Trinidadians and Tobagonians | 8.8 /100 | #222 | Tragic 35.7% |
| French Canadians | 8.3 /100 | #223 | Tragic 35.6% |
| Immigrants | Barbados | 7.5 /100 | #224 | Tragic 35.5% |