Menominee vs Yaqui Female Disability
COMPARE
Menominee
Yaqui
Female Disability
Female Disability Comparison
Menominee
Yaqui
12.6%
FEMALE DISABILITY
2.1/ 100
METRIC RATING
247th/ 347
METRIC RANK
13.2%
FEMALE DISABILITY
0.0/ 100
METRIC RATING
287th/ 347
METRIC RANK
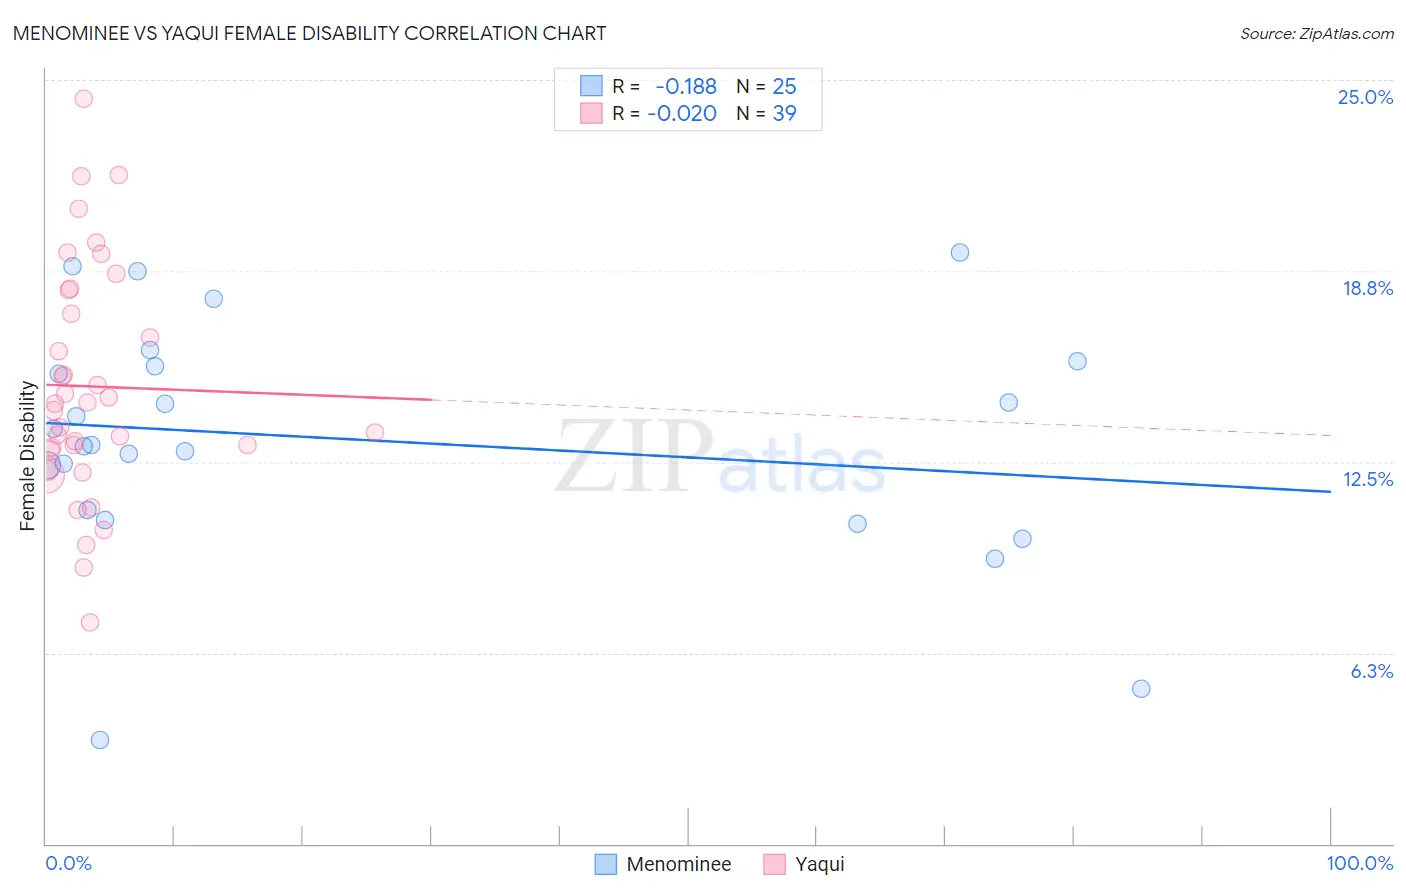
Menominee vs Yaqui Female Disability Correlation Chart
The statistical analysis conducted on geographies consisting of 45,777,730 people shows a poor negative correlation between the proportion of Menominee and percentage of females with a disability in the United States with a correlation coefficient (R) of -0.188 and weighted average of 12.6%. Similarly, the statistical analysis conducted on geographies consisting of 107,719,665 people shows no correlation between the proportion of Yaqui and percentage of females with a disability in the United States with a correlation coefficient (R) of -0.020 and weighted average of 13.2%, a difference of 4.2%.
Female Disability Correlation Summary
| Measurement | Menominee | Yaqui |
| Minimum | 3.4% | 7.2% |
| Maximum | 19.4% | 24.4% |
| Range | 16.0% | 17.1% |
| Mean | 13.2% | 15.0% |
| Median | 13.0% | 14.4% |
| Interquartile 25% (IQ1) | 10.8% | 12.9% |
| Interquartile 75% (IQ3) | 15.7% | 18.1% |
| Interquartile Range (IQR) | 5.0% | 5.2% |
| Standard Deviation (Sample) | 3.9% | 3.8% |
| Standard Deviation (Population) | 3.8% | 3.8% |
Similar Demographics by Female Disability
Demographics Similar to Menominee by Female Disability
In terms of female disability, the demographic groups most similar to Menominee are Spanish American Indian (12.6%, a difference of 0.010%), Immigrants from Jamaica (12.6%, a difference of 0.030%), Carpatho Rusyn (12.6%, a difference of 0.040%), Alsatian (12.6%, a difference of 0.16%), and Immigrants from Congo (12.7%, a difference of 0.16%).
| Demographics | Rating | Rank | Female Disability |
| German Russians | 3.2 /100 | #240 | Tragic 12.6% |
| Japanese | 2.7 /100 | #241 | Tragic 12.6% |
| Canadians | 2.6 /100 | #242 | Tragic 12.6% |
| Immigrants | Senegal | 2.5 /100 | #243 | Tragic 12.6% |
| Alsatians | 2.5 /100 | #244 | Tragic 12.6% |
| Immigrants | Jamaica | 2.2 /100 | #245 | Tragic 12.6% |
| Spanish American Indians | 2.1 /100 | #246 | Tragic 12.6% |
| Menominee | 2.1 /100 | #247 | Tragic 12.6% |
| Carpatho Rusyns | 2.0 /100 | #248 | Tragic 12.6% |
| Immigrants | Congo | 1.8 /100 | #249 | Tragic 12.7% |
| Slovenes | 1.7 /100 | #250 | Tragic 12.7% |
| Crow | 1.6 /100 | #251 | Tragic 12.7% |
| Immigrants | Caribbean | 1.4 /100 | #252 | Tragic 12.7% |
| Jamaicans | 1.4 /100 | #253 | Tragic 12.7% |
| Hawaiians | 1.4 /100 | #254 | Tragic 12.7% |
Demographics Similar to Yaqui by Female Disability
In terms of female disability, the demographic groups most similar to Yaqui are White/Caucasian (13.2%, a difference of 0.10%), Tlingit-Haida (13.2%, a difference of 0.27%), Immigrants from Yemen (13.2%, a difference of 0.27%), Shoshone (13.2%, a difference of 0.34%), and Yakama (13.2%, a difference of 0.50%).
| Demographics | Rating | Rank | Female Disability |
| Irish | 0.1 /100 | #280 | Tragic 13.1% |
| U.S. Virgin Islanders | 0.1 /100 | #281 | Tragic 13.1% |
| Welsh | 0.0 /100 | #282 | Tragic 13.1% |
| English | 0.0 /100 | #283 | Tragic 13.1% |
| Hmong | 0.0 /100 | #284 | Tragic 13.1% |
| Bangladeshis | 0.0 /100 | #285 | Tragic 13.1% |
| Fijians | 0.0 /100 | #286 | Tragic 13.1% |
| Yaqui | 0.0 /100 | #287 | Tragic 13.2% |
| Whites/Caucasians | 0.0 /100 | #288 | Tragic 13.2% |
| Tlingit-Haida | 0.0 /100 | #289 | Tragic 13.2% |
| Immigrants | Yemen | 0.0 /100 | #290 | Tragic 13.2% |
| Shoshone | 0.0 /100 | #291 | Tragic 13.2% |
| Yakama | 0.0 /100 | #292 | Tragic 13.2% |
| Marshallese | 0.0 /100 | #293 | Tragic 13.3% |
| Celtics | 0.0 /100 | #294 | Tragic 13.3% |