Immigrants from Belarus vs Yaqui Female Disability
COMPARE
Immigrants from Belarus
Yaqui
Female Disability
Female Disability Comparison
Immigrants from Belarus
Yaqui
11.8%
FEMALE DISABILITY
97.8/ 100
METRIC RATING
113th/ 347
METRIC RANK
13.2%
FEMALE DISABILITY
0.0/ 100
METRIC RATING
287th/ 347
METRIC RANK
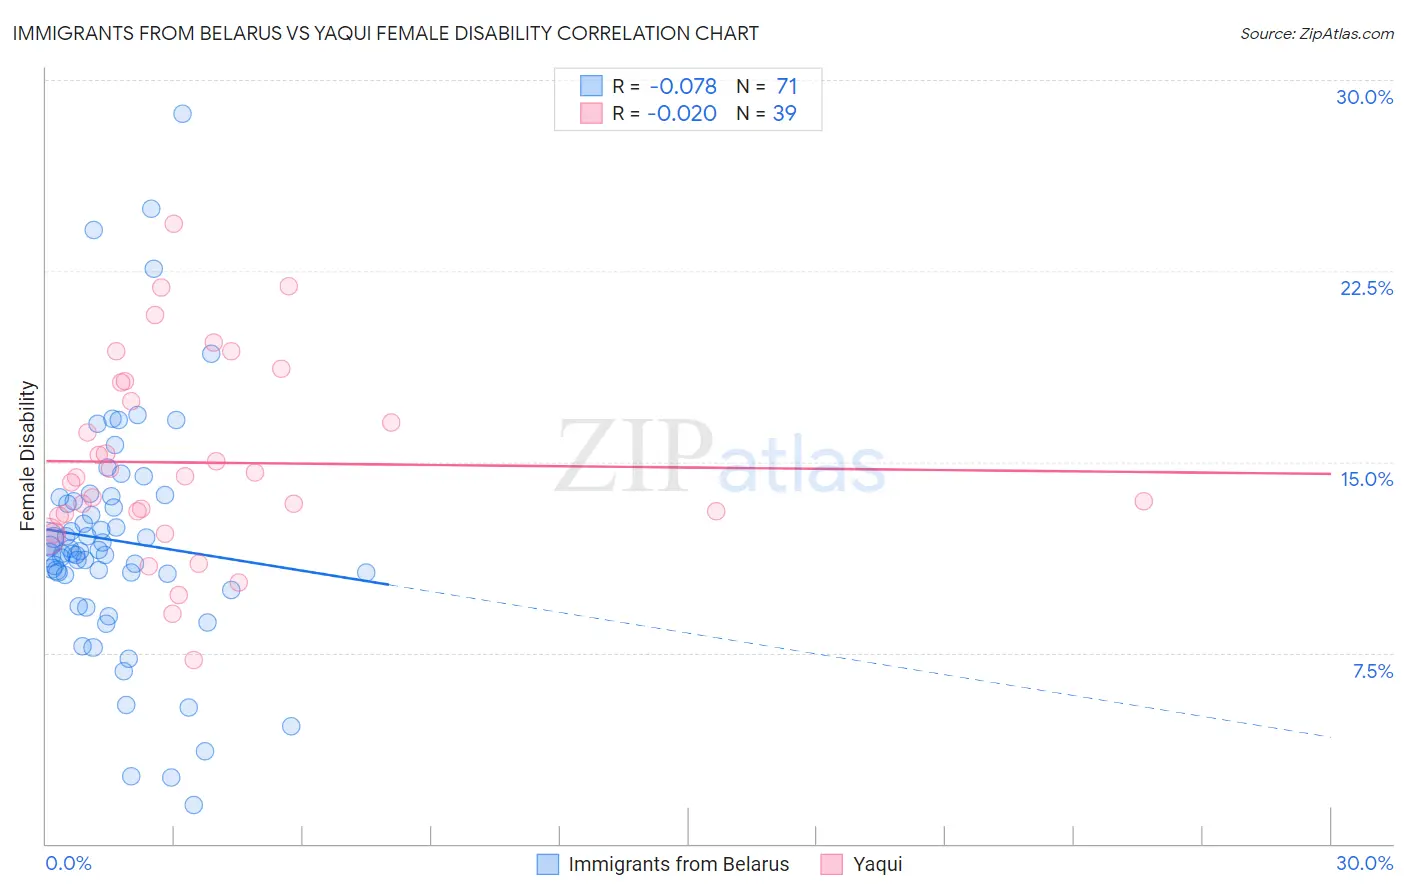
Immigrants from Belarus vs Yaqui Female Disability Correlation Chart
The statistical analysis conducted on geographies consisting of 150,193,098 people shows a slight negative correlation between the proportion of Immigrants from Belarus and percentage of females with a disability in the United States with a correlation coefficient (R) of -0.078 and weighted average of 11.8%. Similarly, the statistical analysis conducted on geographies consisting of 107,719,665 people shows no correlation between the proportion of Yaqui and percentage of females with a disability in the United States with a correlation coefficient (R) of -0.020 and weighted average of 13.2%, a difference of 12.0%.
Female Disability Correlation Summary
| Measurement | Immigrants from Belarus | Yaqui |
| Minimum | 1.5% | 7.2% |
| Maximum | 28.7% | 24.4% |
| Range | 27.2% | 17.1% |
| Mean | 11.9% | 15.0% |
| Median | 11.5% | 14.4% |
| Interquartile 25% (IQ1) | 10.6% | 12.9% |
| Interquartile 75% (IQ3) | 13.6% | 18.1% |
| Interquartile Range (IQR) | 3.0% | 5.2% |
| Standard Deviation (Sample) | 4.7% | 3.8% |
| Standard Deviation (Population) | 4.7% | 3.8% |
Similar Demographics by Female Disability
Demographics Similar to Immigrants from Belarus by Female Disability
In terms of female disability, the demographic groups most similar to Immigrants from Belarus are Immigrants from Bangladesh (11.8%, a difference of 0.010%), South African (11.8%, a difference of 0.030%), Brazilian (11.8%, a difference of 0.030%), Immigrants from Morocco (11.8%, a difference of 0.070%), and Costa Rican (11.7%, a difference of 0.13%).
| Demographics | Rating | Rank | Female Disability |
| Immigrants | Greece | 98.2 /100 | #106 | Exceptional 11.7% |
| Latvians | 98.2 /100 | #107 | Exceptional 11.7% |
| New Zealanders | 98.1 /100 | #108 | Exceptional 11.7% |
| Immigrants | Immigrants | 98.1 /100 | #109 | Exceptional 11.7% |
| Soviet Union | 98.1 /100 | #110 | Exceptional 11.7% |
| Costa Ricans | 98.1 /100 | #111 | Exceptional 11.7% |
| Immigrants | Bangladesh | 97.8 /100 | #112 | Exceptional 11.8% |
| Immigrants | Belarus | 97.8 /100 | #113 | Exceptional 11.8% |
| South Africans | 97.7 /100 | #114 | Exceptional 11.8% |
| Brazilians | 97.7 /100 | #115 | Exceptional 11.8% |
| Immigrants | Morocco | 97.6 /100 | #116 | Exceptional 11.8% |
| Immigrants | Eastern Europe | 97.2 /100 | #117 | Exceptional 11.8% |
| Immigrants | Nigeria | 97.2 /100 | #118 | Exceptional 11.8% |
| Immigrants | Uganda | 97.2 /100 | #119 | Exceptional 11.8% |
| Immigrants | Kazakhstan | 97.0 /100 | #120 | Exceptional 11.8% |
Demographics Similar to Yaqui by Female Disability
In terms of female disability, the demographic groups most similar to Yaqui are White/Caucasian (13.2%, a difference of 0.10%), Tlingit-Haida (13.2%, a difference of 0.27%), Immigrants from Yemen (13.2%, a difference of 0.27%), Shoshone (13.2%, a difference of 0.34%), and Yakama (13.2%, a difference of 0.50%).
| Demographics | Rating | Rank | Female Disability |
| Irish | 0.1 /100 | #280 | Tragic 13.1% |
| U.S. Virgin Islanders | 0.1 /100 | #281 | Tragic 13.1% |
| Welsh | 0.0 /100 | #282 | Tragic 13.1% |
| English | 0.0 /100 | #283 | Tragic 13.1% |
| Hmong | 0.0 /100 | #284 | Tragic 13.1% |
| Bangladeshis | 0.0 /100 | #285 | Tragic 13.1% |
| Fijians | 0.0 /100 | #286 | Tragic 13.1% |
| Yaqui | 0.0 /100 | #287 | Tragic 13.2% |
| Whites/Caucasians | 0.0 /100 | #288 | Tragic 13.2% |
| Tlingit-Haida | 0.0 /100 | #289 | Tragic 13.2% |
| Immigrants | Yemen | 0.0 /100 | #290 | Tragic 13.2% |
| Shoshone | 0.0 /100 | #291 | Tragic 13.2% |
| Yakama | 0.0 /100 | #292 | Tragic 13.2% |
| Marshallese | 0.0 /100 | #293 | Tragic 13.3% |
| Celtics | 0.0 /100 | #294 | Tragic 13.3% |