Menominee vs Immigrants from Norway Female Disability
COMPARE
Menominee
Immigrants from Norway
Female Disability
Female Disability Comparison
Menominee
Immigrants from Norway
12.6%
FEMALE DISABILITY
2.1/ 100
METRIC RATING
247th/ 347
METRIC RANK
11.9%
FEMALE DISABILITY
93.8/ 100
METRIC RATING
137th/ 347
METRIC RANK
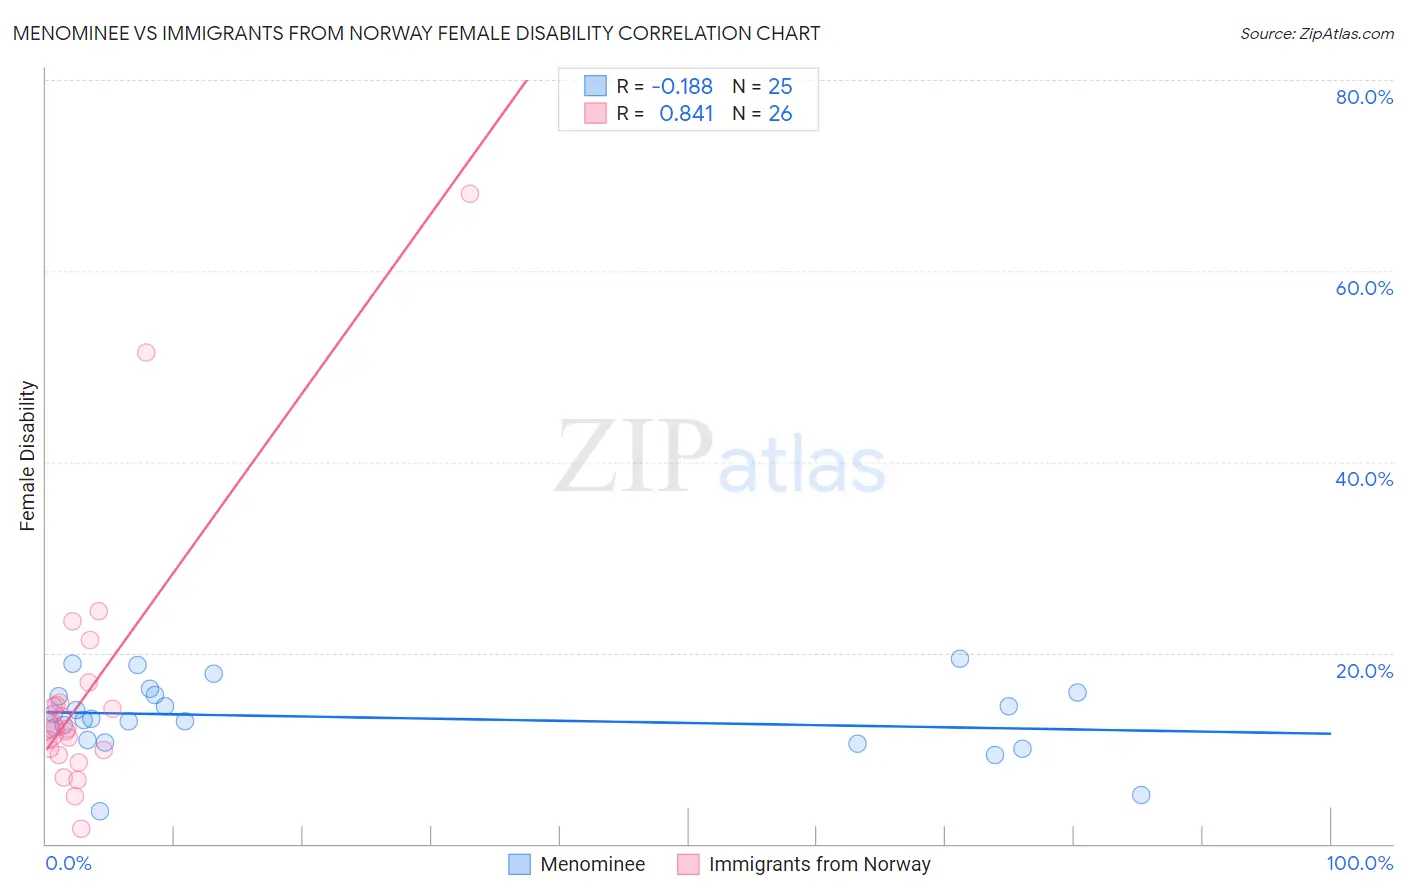
Menominee vs Immigrants from Norway Female Disability Correlation Chart
The statistical analysis conducted on geographies consisting of 45,777,730 people shows a poor negative correlation between the proportion of Menominee and percentage of females with a disability in the United States with a correlation coefficient (R) of -0.188 and weighted average of 12.6%. Similarly, the statistical analysis conducted on geographies consisting of 116,702,841 people shows a very strong positive correlation between the proportion of Immigrants from Norway and percentage of females with a disability in the United States with a correlation coefficient (R) of 0.841 and weighted average of 11.9%, a difference of 6.3%.
Female Disability Correlation Summary
| Measurement | Menominee | Immigrants from Norway |
| Minimum | 3.4% | 1.5% |
| Maximum | 19.4% | 68.1% |
| Range | 16.0% | 66.6% |
| Mean | 13.2% | 16.0% |
| Median | 13.0% | 12.0% |
| Interquartile 25% (IQ1) | 10.8% | 9.8% |
| Interquartile 75% (IQ3) | 15.7% | 14.8% |
| Interquartile Range (IQR) | 5.0% | 5.0% |
| Standard Deviation (Sample) | 3.9% | 14.1% |
| Standard Deviation (Population) | 3.8% | 13.8% |
Similar Demographics by Female Disability
Demographics Similar to Menominee by Female Disability
In terms of female disability, the demographic groups most similar to Menominee are Spanish American Indian (12.6%, a difference of 0.010%), Immigrants from Jamaica (12.6%, a difference of 0.030%), Carpatho Rusyn (12.6%, a difference of 0.040%), Alsatian (12.6%, a difference of 0.16%), and Immigrants from Congo (12.7%, a difference of 0.16%).
| Demographics | Rating | Rank | Female Disability |
| German Russians | 3.2 /100 | #240 | Tragic 12.6% |
| Japanese | 2.7 /100 | #241 | Tragic 12.6% |
| Canadians | 2.6 /100 | #242 | Tragic 12.6% |
| Immigrants | Senegal | 2.5 /100 | #243 | Tragic 12.6% |
| Alsatians | 2.5 /100 | #244 | Tragic 12.6% |
| Immigrants | Jamaica | 2.2 /100 | #245 | Tragic 12.6% |
| Spanish American Indians | 2.1 /100 | #246 | Tragic 12.6% |
| Menominee | 2.1 /100 | #247 | Tragic 12.6% |
| Carpatho Rusyns | 2.0 /100 | #248 | Tragic 12.6% |
| Immigrants | Congo | 1.8 /100 | #249 | Tragic 12.7% |
| Slovenes | 1.7 /100 | #250 | Tragic 12.7% |
| Crow | 1.6 /100 | #251 | Tragic 12.7% |
| Immigrants | Caribbean | 1.4 /100 | #252 | Tragic 12.7% |
| Jamaicans | 1.4 /100 | #253 | Tragic 12.7% |
| Hawaiians | 1.4 /100 | #254 | Tragic 12.7% |
Demographics Similar to Immigrants from Norway by Female Disability
In terms of female disability, the demographic groups most similar to Immigrants from Norway are Ugandan (11.9%, a difference of 0.040%), Central American (11.9%, a difference of 0.060%), Ecuadorian (11.9%, a difference of 0.060%), Kenyan (11.9%, a difference of 0.13%), and Immigrants from Nicaragua (11.9%, a difference of 0.13%).
| Demographics | Rating | Rank | Female Disability |
| Nicaraguans | 95.2 /100 | #130 | Exceptional 11.9% |
| Arabs | 95.1 /100 | #131 | Exceptional 11.9% |
| Immigrants | Syria | 94.6 /100 | #132 | Exceptional 11.9% |
| Kenyans | 94.5 /100 | #133 | Exceptional 11.9% |
| Immigrants | Nicaragua | 94.5 /100 | #134 | Exceptional 11.9% |
| Central Americans | 94.2 /100 | #135 | Exceptional 11.9% |
| Ugandans | 94.0 /100 | #136 | Exceptional 11.9% |
| Immigrants | Norway | 93.8 /100 | #137 | Exceptional 11.9% |
| Ecuadorians | 93.4 /100 | #138 | Exceptional 11.9% |
| Immigrants | Hungary | 92.8 /100 | #139 | Exceptional 11.9% |
| Romanians | 91.6 /100 | #140 | Exceptional 11.9% |
| Immigrants | Ecuador | 91.5 /100 | #141 | Exceptional 11.9% |
| Immigrants | Africa | 90.0 /100 | #142 | Excellent 11.9% |
| Immigrants | Sudan | 89.6 /100 | #143 | Excellent 11.9% |
| Immigrants | Austria | 87.9 /100 | #144 | Excellent 12.0% |