Immigrants from Albania vs Yaqui Female Disability
COMPARE
Immigrants from Albania
Yaqui
Female Disability
Female Disability Comparison
Immigrants from Albania
Yaqui
12.3%
FEMALE DISABILITY
31.6/ 100
METRIC RATING
189th/ 347
METRIC RANK
13.2%
FEMALE DISABILITY
0.0/ 100
METRIC RATING
287th/ 347
METRIC RANK
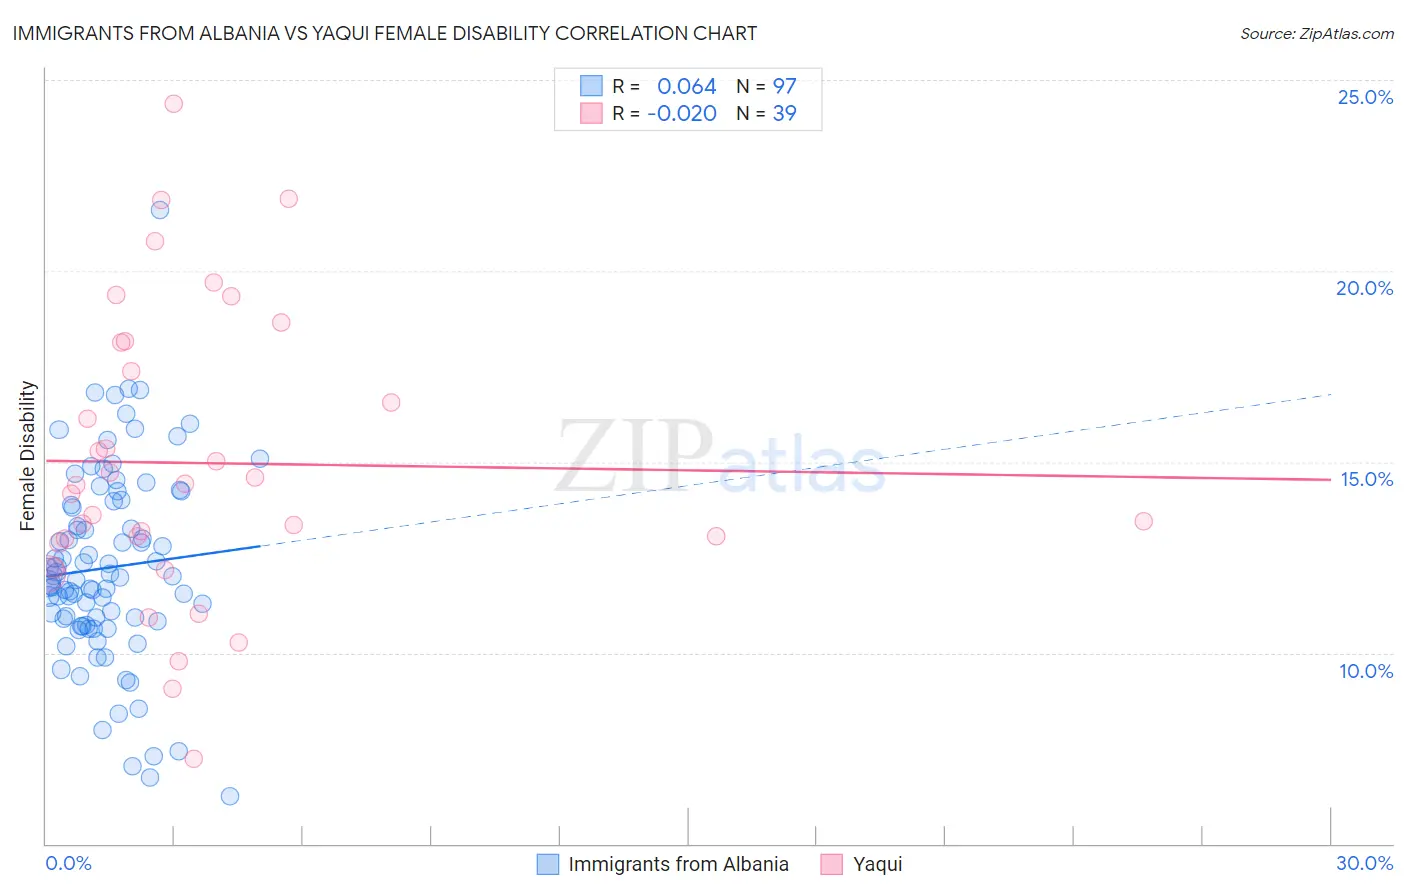
Immigrants from Albania vs Yaqui Female Disability Correlation Chart
The statistical analysis conducted on geographies consisting of 119,399,114 people shows a slight positive correlation between the proportion of Immigrants from Albania and percentage of females with a disability in the United States with a correlation coefficient (R) of 0.064 and weighted average of 12.3%. Similarly, the statistical analysis conducted on geographies consisting of 107,719,665 people shows no correlation between the proportion of Yaqui and percentage of females with a disability in the United States with a correlation coefficient (R) of -0.020 and weighted average of 13.2%, a difference of 7.2%.
Female Disability Correlation Summary
| Measurement | Immigrants from Albania | Yaqui |
| Minimum | 6.2% | 7.2% |
| Maximum | 21.6% | 24.4% |
| Range | 15.4% | 17.1% |
| Mean | 12.2% | 15.0% |
| Median | 12.0% | 14.4% |
| Interquartile 25% (IQ1) | 10.8% | 12.9% |
| Interquartile 75% (IQ3) | 13.9% | 18.1% |
| Interquartile Range (IQR) | 3.1% | 5.2% |
| Standard Deviation (Sample) | 2.5% | 3.8% |
| Standard Deviation (Population) | 2.5% | 3.8% |
Similar Demographics by Female Disability
Demographics Similar to Immigrants from Albania by Female Disability
In terms of female disability, the demographic groups most similar to Immigrants from Albania are Immigrants from Honduras (12.3%, a difference of 0.010%), Immigrants from North America (12.3%, a difference of 0.050%), Serbian (12.3%, a difference of 0.070%), Austrian (12.3%, a difference of 0.080%), and Armenian (12.3%, a difference of 0.080%).
| Demographics | Rating | Rank | Female Disability |
| Norwegians | 36.9 /100 | #182 | Fair 12.3% |
| Cubans | 36.5 /100 | #183 | Fair 12.3% |
| Iraqis | 36.0 /100 | #184 | Fair 12.3% |
| Immigrants | Uzbekistan | 33.9 /100 | #185 | Fair 12.3% |
| Austrians | 33.3 /100 | #186 | Fair 12.3% |
| Serbians | 33.1 /100 | #187 | Fair 12.3% |
| Immigrants | North America | 32.8 /100 | #188 | Fair 12.3% |
| Immigrants | Albania | 31.6 /100 | #189 | Fair 12.3% |
| Immigrants | Honduras | 31.3 /100 | #190 | Fair 12.3% |
| Armenians | 29.7 /100 | #191 | Fair 12.3% |
| Immigrants | Western Africa | 29.2 /100 | #192 | Fair 12.3% |
| Northern Europeans | 27.5 /100 | #193 | Fair 12.3% |
| Ukrainians | 27.2 /100 | #194 | Fair 12.3% |
| Swedes | 26.6 /100 | #195 | Fair 12.3% |
| Immigrants | Panama | 25.5 /100 | #196 | Fair 12.3% |
Demographics Similar to Yaqui by Female Disability
In terms of female disability, the demographic groups most similar to Yaqui are White/Caucasian (13.2%, a difference of 0.10%), Tlingit-Haida (13.2%, a difference of 0.27%), Immigrants from Yemen (13.2%, a difference of 0.27%), Shoshone (13.2%, a difference of 0.34%), and Yakama (13.2%, a difference of 0.50%).
| Demographics | Rating | Rank | Female Disability |
| Irish | 0.1 /100 | #280 | Tragic 13.1% |
| U.S. Virgin Islanders | 0.1 /100 | #281 | Tragic 13.1% |
| Welsh | 0.0 /100 | #282 | Tragic 13.1% |
| English | 0.0 /100 | #283 | Tragic 13.1% |
| Hmong | 0.0 /100 | #284 | Tragic 13.1% |
| Bangladeshis | 0.0 /100 | #285 | Tragic 13.1% |
| Fijians | 0.0 /100 | #286 | Tragic 13.1% |
| Yaqui | 0.0 /100 | #287 | Tragic 13.2% |
| Whites/Caucasians | 0.0 /100 | #288 | Tragic 13.2% |
| Tlingit-Haida | 0.0 /100 | #289 | Tragic 13.2% |
| Immigrants | Yemen | 0.0 /100 | #290 | Tragic 13.2% |
| Shoshone | 0.0 /100 | #291 | Tragic 13.2% |
| Yakama | 0.0 /100 | #292 | Tragic 13.2% |
| Marshallese | 0.0 /100 | #293 | Tragic 13.3% |
| Celtics | 0.0 /100 | #294 | Tragic 13.3% |