Menominee vs Chilean Hearing Disability
COMPARE
Menominee
Chilean
Hearing Disability
Hearing Disability Comparison
Menominee
Chileans
3.7%
HEARING DISABILITY
0.0/ 100
METRIC RATING
303rd/ 347
METRIC RANK
2.9%
HEARING DISABILITY
85.8/ 100
METRIC RATING
132nd/ 347
METRIC RANK
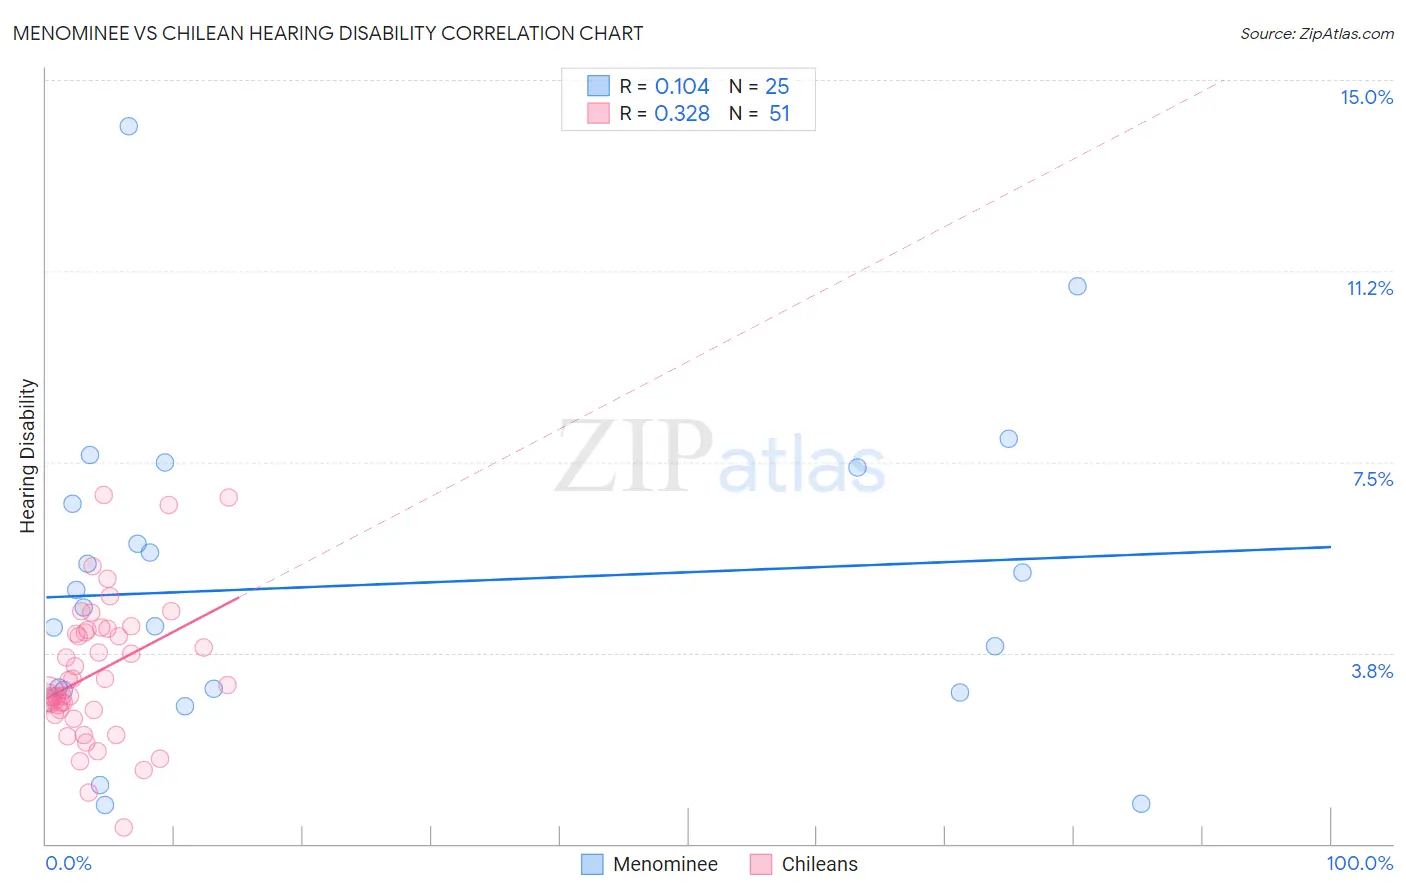
Menominee vs Chilean Hearing Disability Correlation Chart
The statistical analysis conducted on geographies consisting of 45,777,415 people shows a poor positive correlation between the proportion of Menominee and percentage of population with hearing disability in the United States with a correlation coefficient (R) of 0.104 and weighted average of 3.7%. Similarly, the statistical analysis conducted on geographies consisting of 256,625,228 people shows a mild positive correlation between the proportion of Chileans and percentage of population with hearing disability in the United States with a correlation coefficient (R) of 0.328 and weighted average of 2.9%, a difference of 30.5%.
Hearing Disability Correlation Summary
| Measurement | Menominee | Chilean |
| Minimum | 0.77% | 0.32% |
| Maximum | 14.1% | 6.9% |
| Range | 13.3% | 6.5% |
| Mean | 5.1% | 3.4% |
| Median | 4.6% | 3.1% |
| Interquartile 25% (IQ1) | 3.0% | 2.6% |
| Interquartile 75% (IQ3) | 7.0% | 4.2% |
| Interquartile Range (IQR) | 4.0% | 1.6% |
| Standard Deviation (Sample) | 3.1% | 1.4% |
| Standard Deviation (Population) | 3.0% | 1.4% |
Similar Demographics by Hearing Disability
Demographics Similar to Menominee by Hearing Disability
In terms of hearing disability, the demographic groups most similar to Menominee are Dutch (3.7%, a difference of 0.060%), Pennsylvania German (3.7%, a difference of 0.16%), Scottish (3.7%, a difference of 0.19%), German (3.7%, a difference of 0.25%), and French (3.8%, a difference of 0.30%).
| Demographics | Rating | Rank | Hearing Disability |
| Pima | 0.0 /100 | #296 | Tragic 3.7% |
| Immigrants | Azores | 0.0 /100 | #297 | Tragic 3.7% |
| Celtics | 0.0 /100 | #298 | Tragic 3.7% |
| Germans | 0.0 /100 | #299 | Tragic 3.7% |
| Scottish | 0.0 /100 | #300 | Tragic 3.7% |
| Pennsylvania Germans | 0.0 /100 | #301 | Tragic 3.7% |
| Dutch | 0.0 /100 | #302 | Tragic 3.7% |
| Menominee | 0.0 /100 | #303 | Tragic 3.7% |
| French | 0.0 /100 | #304 | Tragic 3.8% |
| English | 0.0 /100 | #305 | Tragic 3.8% |
| Marshallese | 0.0 /100 | #306 | Tragic 3.8% |
| French Canadians | 0.0 /100 | #307 | Tragic 3.8% |
| Ottawa | 0.0 /100 | #308 | Tragic 3.8% |
| Scotch-Irish | 0.0 /100 | #309 | Tragic 3.8% |
| Cree | 0.0 /100 | #310 | Tragic 3.8% |
Demographics Similar to Chileans by Hearing Disability
In terms of hearing disability, the demographic groups most similar to Chileans are Immigrants from Syria (2.9%, a difference of 0.0%), Immigrants from Kenya (2.9%, a difference of 0.050%), Ugandan (2.9%, a difference of 0.070%), Immigrants from Vietnam (2.9%, a difference of 0.14%), and Immigrants from Uganda (2.9%, a difference of 0.16%).
| Demographics | Rating | Rank | Hearing Disability |
| Immigrants | Albania | 88.5 /100 | #125 | Excellent 2.9% |
| Immigrants | Sudan | 87.8 /100 | #126 | Excellent 2.9% |
| South American Indians | 86.9 /100 | #127 | Excellent 2.9% |
| Immigrants | Western Asia | 86.9 /100 | #128 | Excellent 2.9% |
| Immigrants | Uganda | 86.6 /100 | #129 | Excellent 2.9% |
| Immigrants | Vietnam | 86.5 /100 | #130 | Excellent 2.9% |
| Immigrants | Kenya | 86.1 /100 | #131 | Excellent 2.9% |
| Chileans | 85.8 /100 | #132 | Excellent 2.9% |
| Immigrants | Syria | 85.8 /100 | #133 | Excellent 2.9% |
| Ugandans | 85.5 /100 | #134 | Excellent 2.9% |
| Soviet Union | 84.8 /100 | #135 | Excellent 2.9% |
| Immigrants | Brazil | 84.6 /100 | #136 | Excellent 2.9% |
| Sri Lankans | 84.1 /100 | #137 | Excellent 2.9% |
| Immigrants | Costa Rica | 84.0 /100 | #138 | Excellent 2.9% |
| Bermudans | 83.8 /100 | #139 | Excellent 2.9% |