Immigrants from Zaire vs Luxembourger Hearing Disability
COMPARE
Immigrants from Zaire
Luxembourger
Hearing Disability
Hearing Disability Comparison
Immigrants from Zaire
Luxembourgers
2.9%
HEARING DISABILITY
88.6/ 100
METRIC RATING
123rd/ 347
METRIC RANK
3.2%
HEARING DISABILITY
2.9/ 100
METRIC RATING
231st/ 347
METRIC RANK
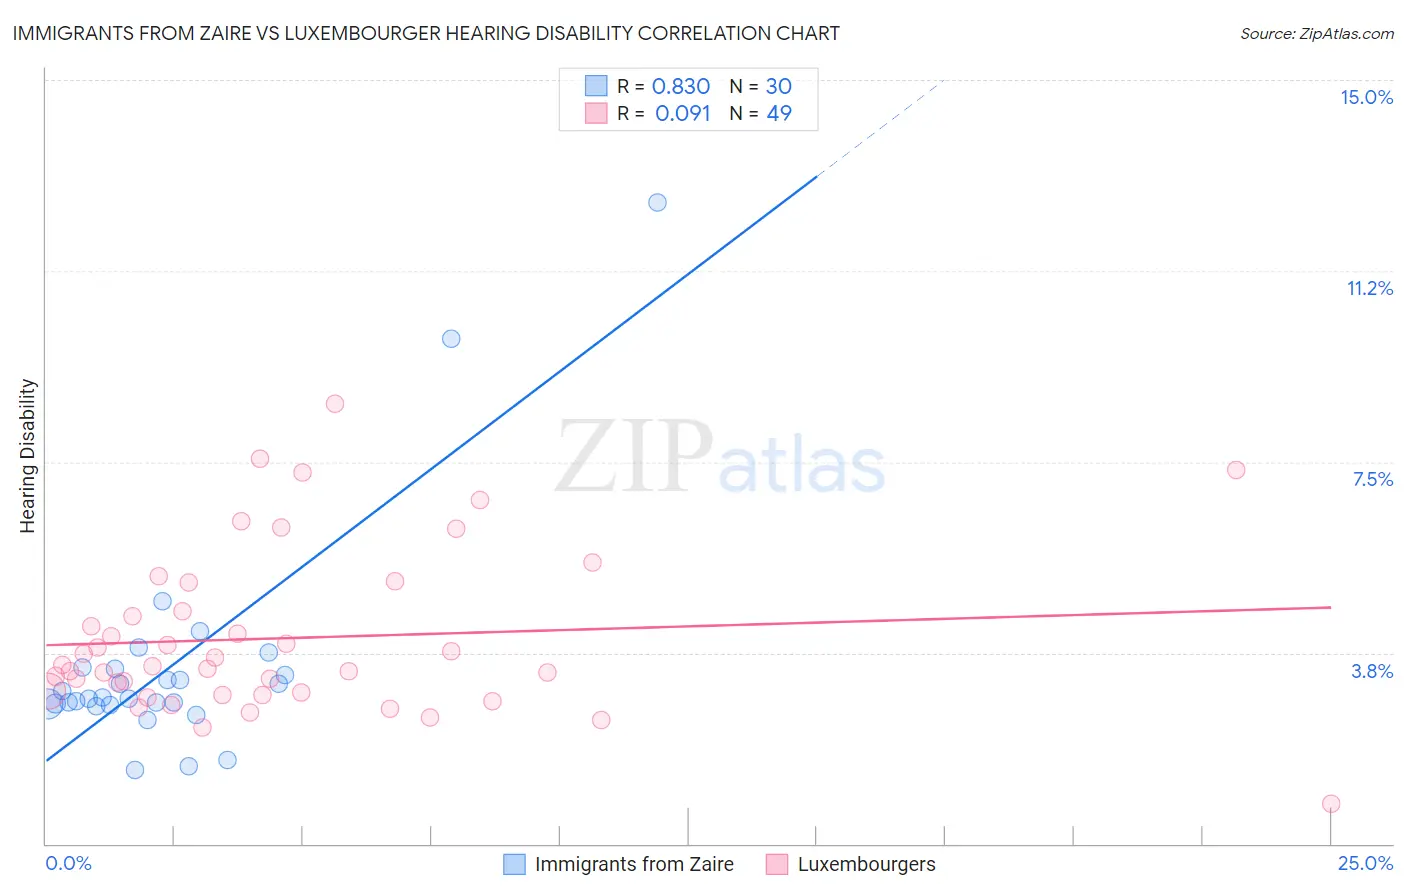
Immigrants from Zaire vs Luxembourger Hearing Disability Correlation Chart
The statistical analysis conducted on geographies consisting of 107,252,507 people shows a very strong positive correlation between the proportion of Immigrants from Zaire and percentage of population with hearing disability in the United States with a correlation coefficient (R) of 0.830 and weighted average of 2.9%. Similarly, the statistical analysis conducted on geographies consisting of 144,678,787 people shows a slight positive correlation between the proportion of Luxembourgers and percentage of population with hearing disability in the United States with a correlation coefficient (R) of 0.091 and weighted average of 3.2%, a difference of 13.7%.
Hearing Disability Correlation Summary
| Measurement | Immigrants from Zaire | Luxembourger |
| Minimum | 1.4% | 0.78% |
| Maximum | 12.6% | 8.6% |
| Range | 11.1% | 7.9% |
| Mean | 3.5% | 4.0% |
| Median | 2.9% | 3.5% |
| Interquartile 25% (IQ1) | 2.7% | 2.9% |
| Interquartile 75% (IQ3) | 3.4% | 4.9% |
| Interquartile Range (IQR) | 0.68% | 1.9% |
| Standard Deviation (Sample) | 2.2% | 1.6% |
| Standard Deviation (Population) | 2.2% | 1.6% |
Similar Demographics by Hearing Disability
Demographics Similar to Immigrants from Zaire by Hearing Disability
In terms of hearing disability, the demographic groups most similar to Immigrants from Zaire are Bahamian (2.9%, a difference of 0.010%), Immigrants from Albania (2.9%, a difference of 0.030%), Liberian (2.8%, a difference of 0.090%), Cuban (2.8%, a difference of 0.18%), and Immigrants from Sudan (2.9%, a difference of 0.19%).
| Demographics | Rating | Rank | Hearing Disability |
| Immigrants | Immigrants | 90.3 /100 | #116 | Exceptional 2.8% |
| Immigrants | Liberia | 90.0 /100 | #117 | Excellent 2.8% |
| Zimbabweans | 89.9 /100 | #118 | Excellent 2.8% |
| Kenyans | 89.8 /100 | #119 | Excellent 2.8% |
| Jordanians | 89.5 /100 | #120 | Excellent 2.8% |
| Cubans | 89.4 /100 | #121 | Excellent 2.8% |
| Liberians | 89.0 /100 | #122 | Excellent 2.8% |
| Immigrants | Zaire | 88.6 /100 | #123 | Excellent 2.9% |
| Bahamians | 88.6 /100 | #124 | Excellent 2.9% |
| Immigrants | Albania | 88.5 /100 | #125 | Excellent 2.9% |
| Immigrants | Sudan | 87.8 /100 | #126 | Excellent 2.9% |
| South American Indians | 86.9 /100 | #127 | Excellent 2.9% |
| Immigrants | Western Asia | 86.9 /100 | #128 | Excellent 2.9% |
| Immigrants | Uganda | 86.6 /100 | #129 | Excellent 2.9% |
| Immigrants | Vietnam | 86.5 /100 | #130 | Excellent 2.9% |
Demographics Similar to Luxembourgers by Hearing Disability
In terms of hearing disability, the demographic groups most similar to Luxembourgers are Ukrainian (3.2%, a difference of 0.050%), Greek (3.2%, a difference of 0.23%), Estonian (3.3%, a difference of 0.42%), Central American Indian (3.3%, a difference of 0.49%), and Guamanian/Chamorro (3.3%, a difference of 0.60%).
| Demographics | Rating | Rank | Hearing Disability |
| Icelanders | 5.2 /100 | #224 | Tragic 3.2% |
| Latvians | 5.1 /100 | #225 | Tragic 3.2% |
| Lebanese | 5.0 /100 | #226 | Tragic 3.2% |
| Bhutanese | 4.6 /100 | #227 | Tragic 3.2% |
| Immigrants | Portugal | 4.3 /100 | #228 | Tragic 3.2% |
| Maltese | 4.1 /100 | #229 | Tragic 3.2% |
| Greeks | 3.2 /100 | #230 | Tragic 3.2% |
| Luxembourgers | 2.9 /100 | #231 | Tragic 3.2% |
| Ukrainians | 2.9 /100 | #232 | Tragic 3.2% |
| Estonians | 2.4 /100 | #233 | Tragic 3.3% |
| Central American Indians | 2.3 /100 | #234 | Tragic 3.3% |
| Guamanians/Chamorros | 2.2 /100 | #235 | Tragic 3.3% |
| Serbians | 2.2 /100 | #236 | Tragic 3.3% |
| Immigrants | Austria | 1.8 /100 | #237 | Tragic 3.3% |
| German Russians | 1.8 /100 | #238 | Tragic 3.3% |