Yugoslavian vs Immigrants from Bolivia Disability Age Under 5
COMPARE
Yugoslavian
Immigrants from Bolivia
Disability Age Under 5
Disability Age Under 5 Comparison
Yugoslavians
Immigrants from Bolivia
1.4%
DISABILITY AGE UNDER 5
0.1/ 100
METRIC RATING
264th/ 347
METRIC RANK
1.1%
DISABILITY AGE UNDER 5
99.6/ 100
METRIC RATING
52nd/ 347
METRIC RANK
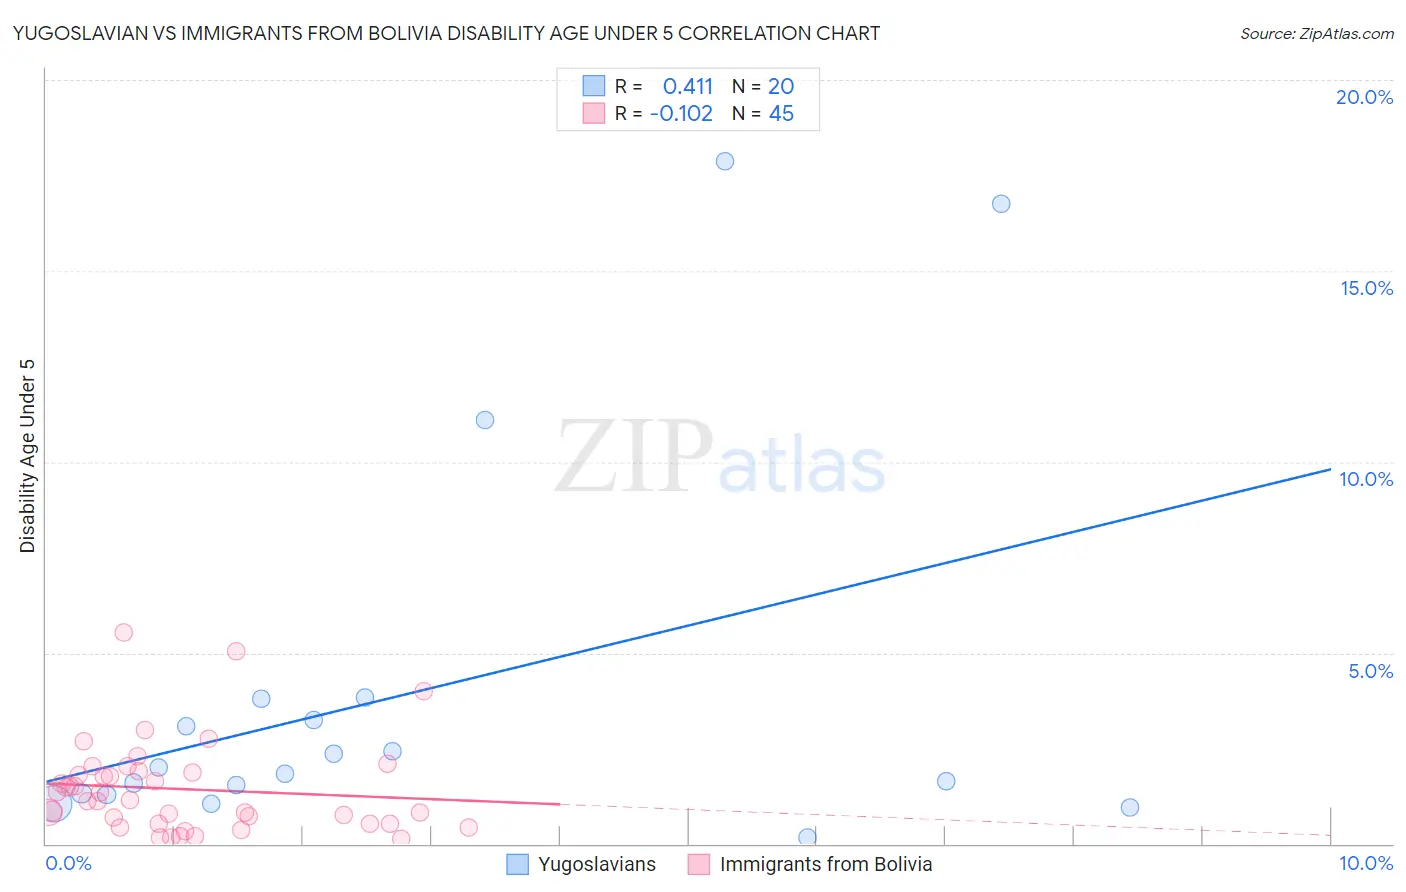
Yugoslavian vs Immigrants from Bolivia Disability Age Under 5 Correlation Chart
The statistical analysis conducted on geographies consisting of 169,705,353 people shows a moderate positive correlation between the proportion of Yugoslavians and percentage of population with a disability under the age of 5 in the United States with a correlation coefficient (R) of 0.411 and weighted average of 1.4%. Similarly, the statistical analysis conducted on geographies consisting of 110,789,799 people shows a poor negative correlation between the proportion of Immigrants from Bolivia and percentage of population with a disability under the age of 5 in the United States with a correlation coefficient (R) of -0.102 and weighted average of 1.1%, a difference of 31.5%.
Disability Age Under 5 Correlation Summary
| Measurement | Yugoslavian | Immigrants from Bolivia |
| Minimum | 0.18% | 0.13% |
| Maximum | 17.9% | 5.5% |
| Range | 17.7% | 5.4% |
| Mean | 3.9% | 1.4% |
| Median | 1.9% | 1.1% |
| Interquartile 25% (IQ1) | 1.3% | 0.53% |
| Interquartile 75% (IQ3) | 3.5% | 1.9% |
| Interquartile Range (IQR) | 2.2% | 1.3% |
| Standard Deviation (Sample) | 5.1% | 1.2% |
| Standard Deviation (Population) | 5.0% | 1.2% |
Similar Demographics by Disability Age Under 5
Demographics Similar to Yugoslavians by Disability Age Under 5
In terms of disability age under 5, the demographic groups most similar to Yugoslavians are Carpatho Rusyn (1.4%, a difference of 0.040%), Immigrants from Germany (1.4%, a difference of 0.080%), Spanish (1.4%, a difference of 0.15%), Immigrants from Dominica (1.4%, a difference of 0.21%), and Immigrants from Netherlands (1.4%, a difference of 0.37%).
| Demographics | Rating | Rank | Disability Age Under 5 |
| Slovenes | 0.3 /100 | #257 | Tragic 1.4% |
| Costa Ricans | 0.3 /100 | #258 | Tragic 1.4% |
| Immigrants | Southern Europe | 0.3 /100 | #259 | Tragic 1.4% |
| Slavs | 0.3 /100 | #260 | Tragic 1.4% |
| Immigrants | Netherlands | 0.2 /100 | #261 | Tragic 1.4% |
| Immigrants | Dominica | 0.2 /100 | #262 | Tragic 1.4% |
| Spanish | 0.2 /100 | #263 | Tragic 1.4% |
| Yugoslavians | 0.1 /100 | #264 | Tragic 1.4% |
| Carpatho Rusyns | 0.1 /100 | #265 | Tragic 1.4% |
| Immigrants | Germany | 0.1 /100 | #266 | Tragic 1.4% |
| Cree | 0.1 /100 | #267 | Tragic 1.4% |
| Belgians | 0.1 /100 | #268 | Tragic 1.4% |
| Austrians | 0.1 /100 | #269 | Tragic 1.4% |
| Immigrants | North America | 0.1 /100 | #270 | Tragic 1.4% |
| Immigrants | Canada | 0.1 /100 | #271 | Tragic 1.4% |
Demographics Similar to Immigrants from Bolivia by Disability Age Under 5
In terms of disability age under 5, the demographic groups most similar to Immigrants from Bolivia are Asian (1.1%, a difference of 0.31%), Immigrants from Kazakhstan (1.1%, a difference of 0.42%), Immigrants from El Salvador (1.1%, a difference of 0.60%), Immigrants from Japan (1.1%, a difference of 0.61%), and Immigrants from Russia (1.1%, a difference of 0.63%).
| Demographics | Rating | Rank | Disability Age Under 5 |
| Immigrants | Turkey | 99.8 /100 | #45 | Exceptional 1.1% |
| Immigrants | Congo | 99.8 /100 | #46 | Exceptional 1.1% |
| Immigrants | Sweden | 99.8 /100 | #47 | Exceptional 1.1% |
| Immigrants | Singapore | 99.7 /100 | #48 | Exceptional 1.1% |
| Immigrants | Russia | 99.7 /100 | #49 | Exceptional 1.1% |
| Immigrants | Japan | 99.7 /100 | #50 | Exceptional 1.1% |
| Immigrants | Kazakhstan | 99.7 /100 | #51 | Exceptional 1.1% |
| Immigrants | Bolivia | 99.6 /100 | #52 | Exceptional 1.1% |
| Asians | 99.6 /100 | #53 | Exceptional 1.1% |
| Immigrants | El Salvador | 99.6 /100 | #54 | Exceptional 1.1% |
| Salvadorans | 99.5 /100 | #55 | Exceptional 1.1% |
| Ecuadorians | 99.5 /100 | #56 | Exceptional 1.1% |
| Assyrians/Chaldeans/Syriacs | 99.5 /100 | #57 | Exceptional 1.1% |
| Immigrants | Egypt | 99.4 /100 | #58 | Exceptional 1.1% |
| Immigrants | Malaysia | 99.4 /100 | #59 | Exceptional 1.1% |