Maltese vs Mexican Unemployment Among Women with Children Under 18 years
COMPARE
Maltese
Mexican
Unemployment Among Women with Children Under 18 years
Unemployment Among Women with Children Under 18 years Comparison
Maltese
Mexicans
5.2%
UNEMPLOYMENT AMONG WOMEN WITH CHILDREN UNDER 18 YEARS
95.1/ 100
METRIC RATING
83rd/ 347
METRIC RANK
6.4%
UNEMPLOYMENT AMONG WOMEN WITH CHILDREN UNDER 18 YEARS
0.0/ 100
METRIC RATING
292nd/ 347
METRIC RANK
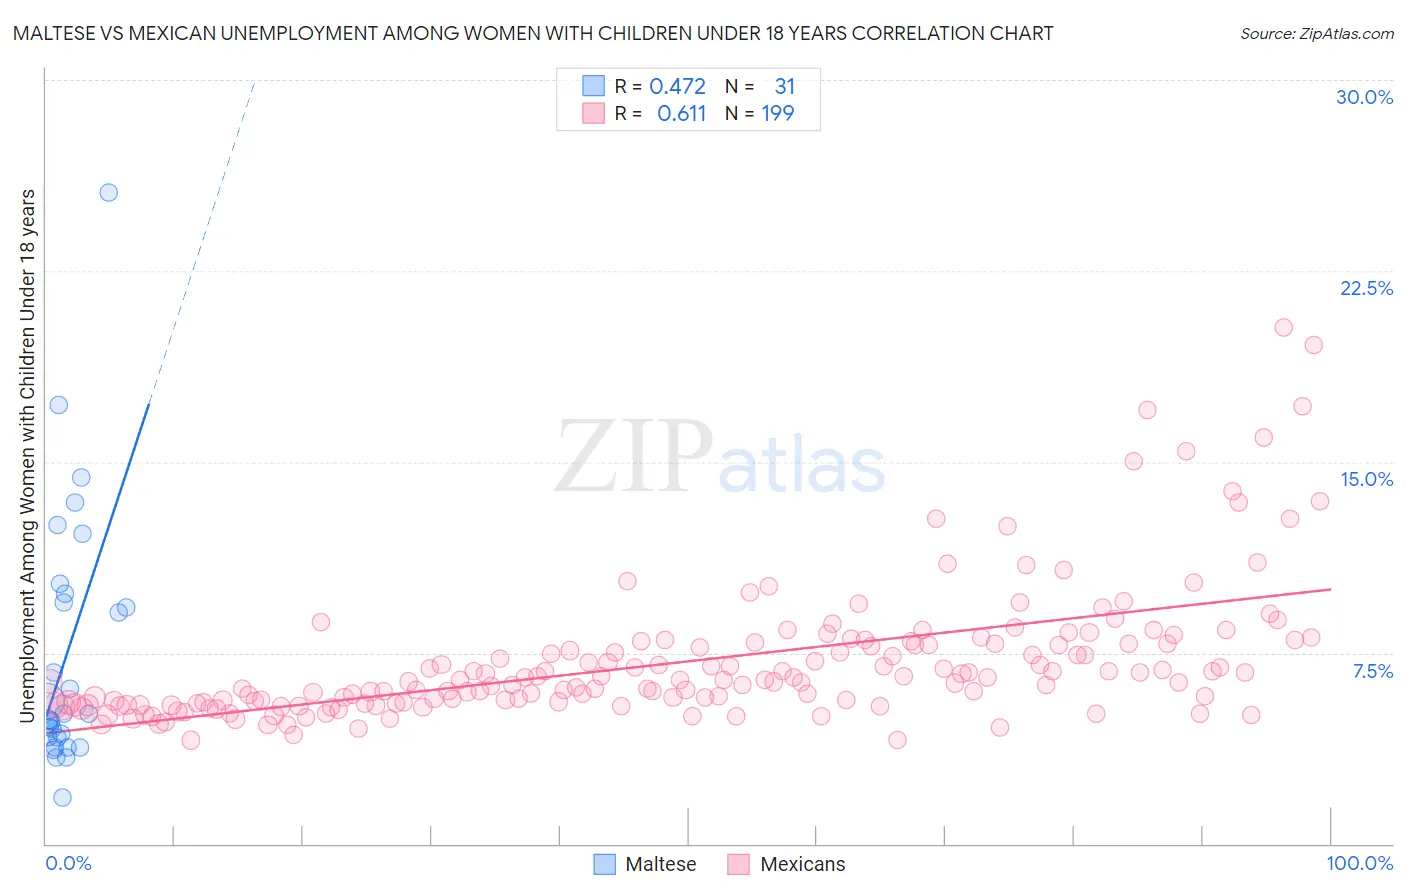
Maltese vs Mexican Unemployment Among Women with Children Under 18 years Correlation Chart
The statistical analysis conducted on geographies consisting of 124,124,771 people shows a moderate positive correlation between the proportion of Maltese and unemployment rate among women with children under the age of 18 in the United States with a correlation coefficient (R) of 0.472 and weighted average of 5.2%. Similarly, the statistical analysis conducted on geographies consisting of 514,834,864 people shows a significant positive correlation between the proportion of Mexicans and unemployment rate among women with children under the age of 18 in the United States with a correlation coefficient (R) of 0.611 and weighted average of 6.4%, a difference of 23.6%.
Unemployment Among Women with Children Under 18 years Correlation Summary
| Measurement | Maltese | Mexican |
| Minimum | 1.8% | 4.1% |
| Maximum | 25.6% | 20.3% |
| Range | 23.8% | 16.2% |
| Mean | 7.5% | 7.2% |
| Median | 5.1% | 6.4% |
| Interquartile 25% (IQ1) | 4.2% | 5.5% |
| Interquartile 75% (IQ3) | 9.8% | 7.9% |
| Interquartile Range (IQR) | 5.6% | 2.3% |
| Standard Deviation (Sample) | 5.1% | 2.7% |
| Standard Deviation (Population) | 5.0% | 2.7% |
Similar Demographics by Unemployment Among Women with Children Under 18 years
Demographics Similar to Maltese by Unemployment Among Women with Children Under 18 years
In terms of unemployment among women with children under 18 years, the demographic groups most similar to Maltese are Australian (5.2%, a difference of 0.0%), Romanian (5.2%, a difference of 0.10%), Paraguayan (5.2%, a difference of 0.11%), Immigrants from Indonesia (5.2%, a difference of 0.13%), and Immigrants from Lithuania (5.2%, a difference of 0.15%).
| Demographics | Rating | Rank | Unemployment Among Women with Children Under 18 years |
| Puget Sound Salish | 95.8 /100 | #76 | Exceptional 5.1% |
| Zimbabweans | 95.7 /100 | #77 | Exceptional 5.1% |
| Assyrians/Chaldeans/Syriacs | 95.7 /100 | #78 | Exceptional 5.1% |
| Immigrants | Croatia | 95.6 /100 | #79 | Exceptional 5.1% |
| Bolivians | 95.5 /100 | #80 | Exceptional 5.1% |
| Immigrants | Lithuania | 95.4 /100 | #81 | Exceptional 5.2% |
| Romanians | 95.3 /100 | #82 | Exceptional 5.2% |
| Maltese | 95.1 /100 | #83 | Exceptional 5.2% |
| Australians | 95.1 /100 | #84 | Exceptional 5.2% |
| Paraguayans | 94.8 /100 | #85 | Exceptional 5.2% |
| Immigrants | Indonesia | 94.8 /100 | #86 | Exceptional 5.2% |
| Laotians | 94.7 /100 | #87 | Exceptional 5.2% |
| Immigrants | Scotland | 94.5 /100 | #88 | Exceptional 5.2% |
| Immigrants | Turkey | 94.2 /100 | #89 | Exceptional 5.2% |
| Ukrainians | 93.8 /100 | #90 | Exceptional 5.2% |
Demographics Similar to Mexicans by Unemployment Among Women with Children Under 18 years
In terms of unemployment among women with children under 18 years, the demographic groups most similar to Mexicans are Immigrants from Bangladesh (6.4%, a difference of 0.030%), Immigrants from Guatemala (6.4%, a difference of 0.060%), Honduran (6.4%, a difference of 0.060%), Barbadian (6.4%, a difference of 0.14%), and Haitian (6.4%, a difference of 0.16%).
| Demographics | Rating | Rank | Unemployment Among Women with Children Under 18 years |
| Bahamians | 0.0 /100 | #285 | Tragic 6.3% |
| Alaskan Athabascans | 0.0 /100 | #286 | Tragic 6.3% |
| Kiowa | 0.0 /100 | #287 | Tragic 6.3% |
| Cree | 0.0 /100 | #288 | Tragic 6.3% |
| Immigrants | Caribbean | 0.0 /100 | #289 | Tragic 6.4% |
| Blackfeet | 0.0 /100 | #290 | Tragic 6.4% |
| Immigrants | Guatemala | 0.0 /100 | #291 | Tragic 6.4% |
| Mexicans | 0.0 /100 | #292 | Tragic 6.4% |
| Immigrants | Bangladesh | 0.0 /100 | #293 | Tragic 6.4% |
| Hondurans | 0.0 /100 | #294 | Tragic 6.4% |
| Barbadians | 0.0 /100 | #295 | Tragic 6.4% |
| Haitians | 0.0 /100 | #296 | Tragic 6.4% |
| Immigrants | Senegal | 0.0 /100 | #297 | Tragic 6.4% |
| Immigrants | Latin America | 0.0 /100 | #298 | Tragic 6.4% |
| Jamaicans | 0.0 /100 | #299 | Tragic 6.4% |