Immigrants from Greece vs Mexican Vision Disability
COMPARE
Immigrants from Greece
Mexican
Vision Disability
Vision Disability Comparison
Immigrants from Greece
Mexicans
2.0%
VISION DISABILITY
99.0/ 100
METRIC RATING
64th/ 347
METRIC RANK
2.5%
VISION DISABILITY
0.0/ 100
METRIC RATING
298th/ 347
METRIC RANK
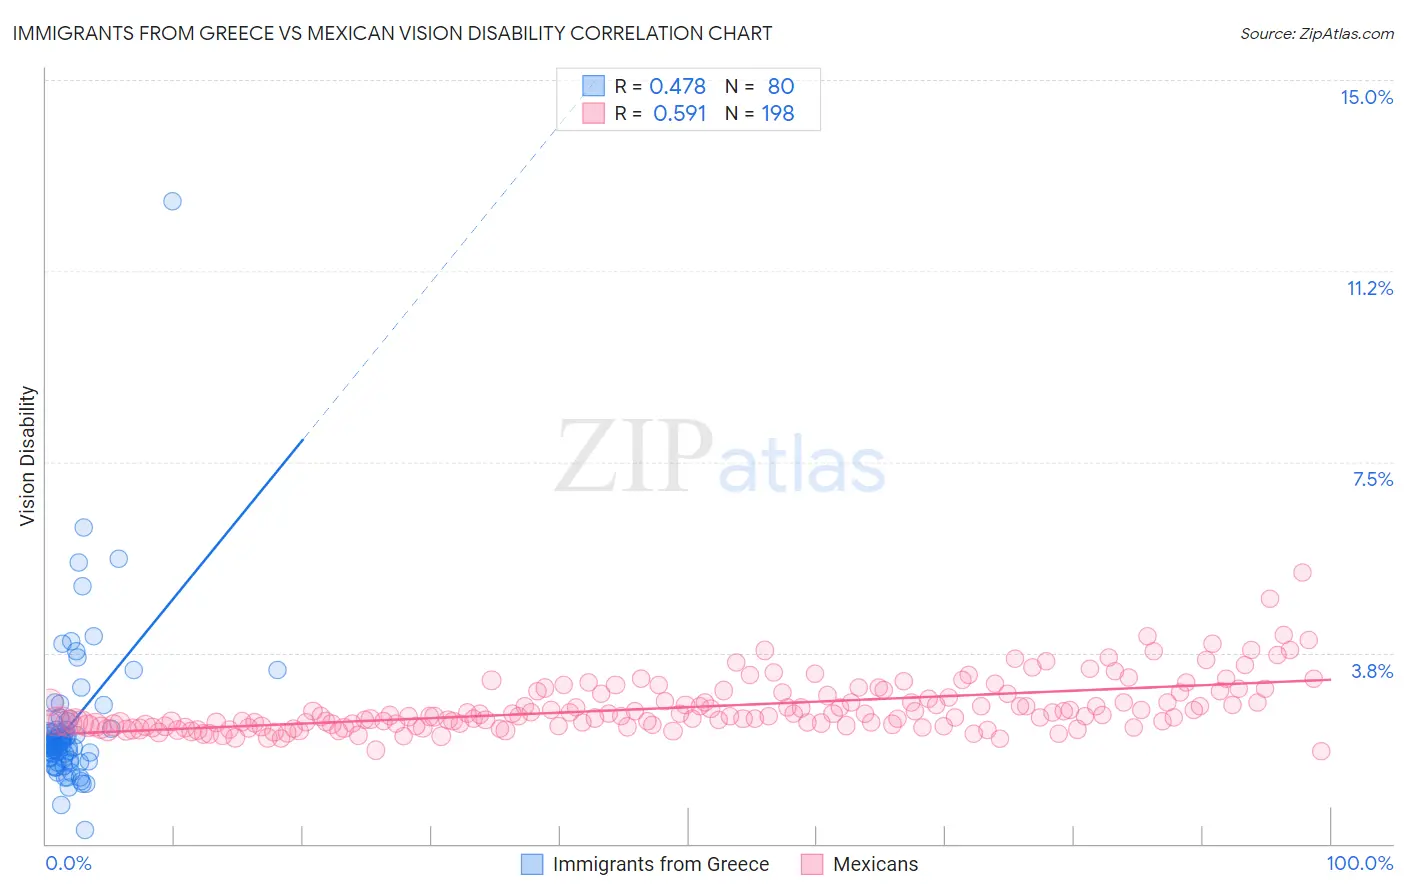
Immigrants from Greece vs Mexican Vision Disability Correlation Chart
The statistical analysis conducted on geographies consisting of 216,813,822 people shows a moderate positive correlation between the proportion of Immigrants from Greece and percentage of population with vision disability in the United States with a correlation coefficient (R) of 0.478 and weighted average of 2.0%. Similarly, the statistical analysis conducted on geographies consisting of 563,538,234 people shows a substantial positive correlation between the proportion of Mexicans and percentage of population with vision disability in the United States with a correlation coefficient (R) of 0.591 and weighted average of 2.5%, a difference of 26.0%.
Vision Disability Correlation Summary
| Measurement | Immigrants from Greece | Mexican |
| Minimum | 0.27% | 1.8% |
| Maximum | 12.6% | 5.3% |
| Range | 12.3% | 3.5% |
| Mean | 2.3% | 2.7% |
| Median | 1.9% | 2.5% |
| Interquartile 25% (IQ1) | 1.7% | 2.3% |
| Interquartile 75% (IQ3) | 2.3% | 2.9% |
| Interquartile Range (IQR) | 0.60% | 0.62% |
| Standard Deviation (Sample) | 1.6% | 0.52% |
| Standard Deviation (Population) | 1.6% | 0.52% |
Similar Demographics by Vision Disability
Demographics Similar to Immigrants from Greece by Vision Disability
In terms of vision disability, the demographic groups most similar to Immigrants from Greece are Maltese (2.0%, a difference of 0.070%), Armenian (2.0%, a difference of 0.13%), Immigrants from Argentina (2.0%, a difference of 0.13%), Immigrants from Russia (2.0%, a difference of 0.24%), and Immigrants from Northern Africa (2.0%, a difference of 0.24%).
| Demographics | Rating | Rank | Vision Disability |
| Somalis | 99.2 /100 | #57 | Exceptional 2.0% |
| Immigrants | Saudi Arabia | 99.2 /100 | #58 | Exceptional 2.0% |
| Argentineans | 99.1 /100 | #59 | Exceptional 2.0% |
| Immigrants | Romania | 99.1 /100 | #60 | Exceptional 2.0% |
| Immigrants | Belgium | 99.1 /100 | #61 | Exceptional 2.0% |
| Immigrants | Russia | 99.1 /100 | #62 | Exceptional 2.0% |
| Armenians | 99.0 /100 | #63 | Exceptional 2.0% |
| Immigrants | Greece | 99.0 /100 | #64 | Exceptional 2.0% |
| Maltese | 98.9 /100 | #65 | Exceptional 2.0% |
| Immigrants | Argentina | 98.9 /100 | #66 | Exceptional 2.0% |
| Immigrants | Northern Africa | 98.8 /100 | #67 | Exceptional 2.0% |
| Immigrants | Czechoslovakia | 98.7 /100 | #68 | Exceptional 2.0% |
| Russians | 98.6 /100 | #69 | Exceptional 2.0% |
| Immigrants | Kazakhstan | 98.6 /100 | #70 | Exceptional 2.0% |
| Immigrants | Northern Europe | 98.6 /100 | #71 | Exceptional 2.0% |
Demographics Similar to Mexicans by Vision Disability
In terms of vision disability, the demographic groups most similar to Mexicans are Cree (2.5%, a difference of 0.040%), Immigrants from Dominica (2.5%, a difference of 0.14%), African (2.5%, a difference of 0.24%), Menominee (2.5%, a difference of 0.41%), and Immigrants from Mexico (2.5%, a difference of 0.82%).
| Demographics | Rating | Rank | Vision Disability |
| Immigrants | Honduras | 0.0 /100 | #291 | Tragic 2.5% |
| Crow | 0.0 /100 | #292 | Tragic 2.5% |
| Yaqui | 0.0 /100 | #293 | Tragic 2.5% |
| Ottawa | 0.0 /100 | #294 | Tragic 2.5% |
| Delaware | 0.0 /100 | #295 | Tragic 2.5% |
| Immigrants | Mexico | 0.0 /100 | #296 | Tragic 2.5% |
| Immigrants | Dominica | 0.0 /100 | #297 | Tragic 2.5% |
| Mexicans | 0.0 /100 | #298 | Tragic 2.5% |
| Cree | 0.0 /100 | #299 | Tragic 2.5% |
| Africans | 0.0 /100 | #300 | Tragic 2.5% |
| Menominee | 0.0 /100 | #301 | Tragic 2.5% |
| Spanish American Indians | 0.0 /100 | #302 | Tragic 2.6% |
| Immigrants | Cabo Verde | 0.0 /100 | #303 | Tragic 2.6% |
| Aleuts | 0.0 /100 | #304 | Tragic 2.6% |
| Hispanics or Latinos | 0.0 /100 | #305 | Tragic 2.6% |