Malaysian vs Scandinavian Nursery School
COMPARE
Malaysian
Scandinavian
Nursery School
Nursery School Comparison
Malaysians
Scandinavians
97.3%
NURSERY SCHOOL
0.0/ 100
METRIC RATING
293rd/ 347
METRIC RANK
98.6%
NURSERY SCHOOL
100.0/ 100
METRIC RATING
33rd/ 347
METRIC RANK
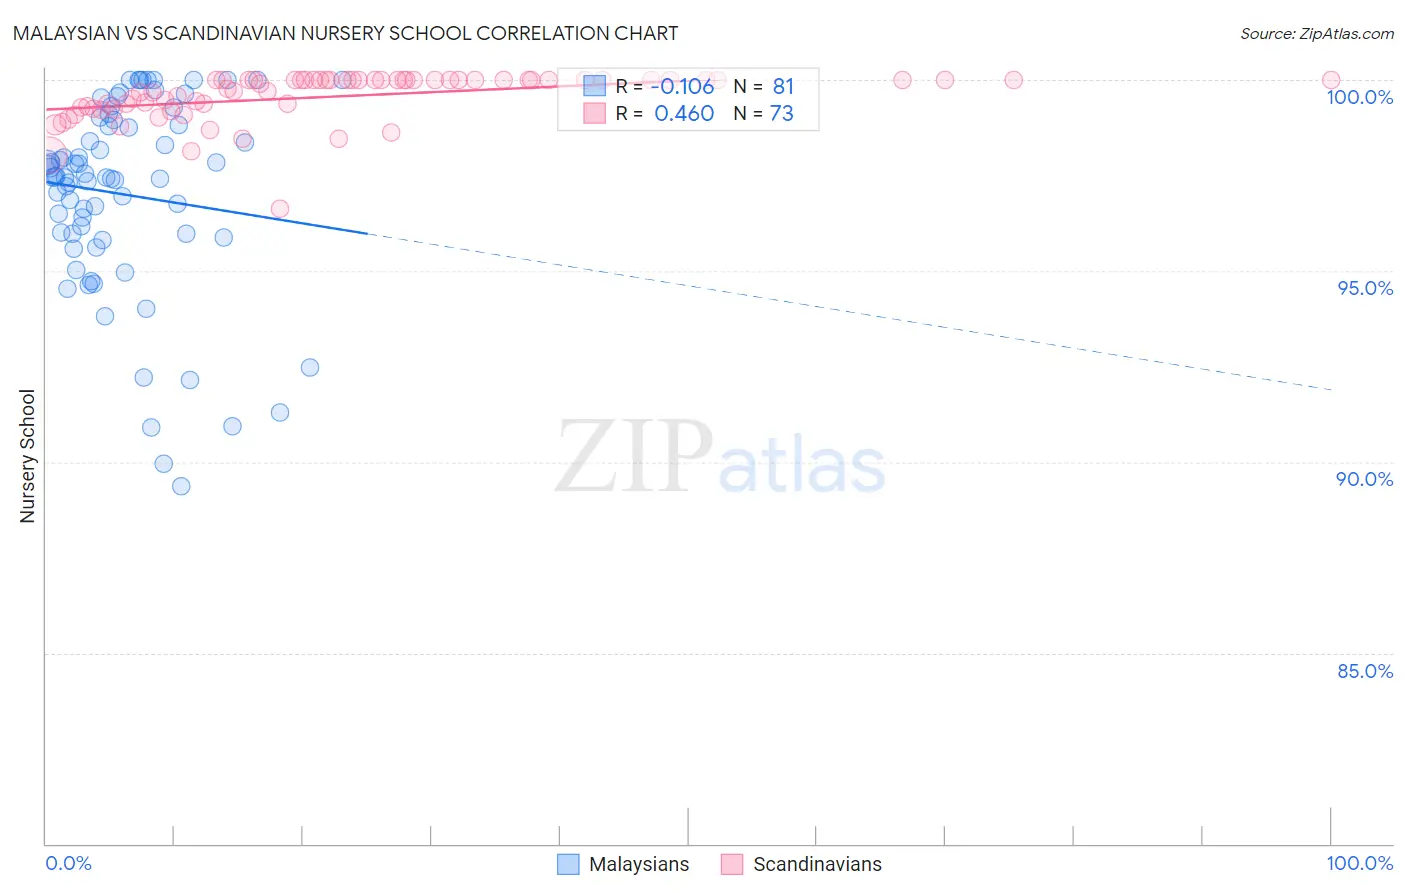
Malaysian vs Scandinavian Nursery School Correlation Chart
The statistical analysis conducted on geographies consisting of 226,107,000 people shows a poor negative correlation between the proportion of Malaysians and percentage of population with at least nursery school education in the United States with a correlation coefficient (R) of -0.106 and weighted average of 97.3%. Similarly, the statistical analysis conducted on geographies consisting of 472,660,430 people shows a moderate positive correlation between the proportion of Scandinavians and percentage of population with at least nursery school education in the United States with a correlation coefficient (R) of 0.460 and weighted average of 98.6%, a difference of 1.4%.
Nursery School Correlation Summary
| Measurement | Malaysian | Scandinavian |
| Minimum | 89.4% | 96.6% |
| Maximum | 100.0% | 100.0% |
| Range | 10.6% | 3.4% |
| Mean | 97.0% | 99.6% |
| Median | 97.5% | 100.0% |
| Interquartile 25% (IQ1) | 95.9% | 99.3% |
| Interquartile 75% (IQ3) | 98.9% | 100.0% |
| Interquartile Range (IQR) | 3.0% | 0.74% |
| Standard Deviation (Sample) | 2.5% | 0.62% |
| Standard Deviation (Population) | 2.5% | 0.62% |
Similar Demographics by Nursery School
Demographics Similar to Malaysians by Nursery School
In terms of nursery school, the demographic groups most similar to Malaysians are Houma (97.3%, a difference of 0.010%), Immigrants from Grenada (97.3%, a difference of 0.010%), Immigrants (97.2%, a difference of 0.020%), British West Indian (97.3%, a difference of 0.030%), and Immigrants from Eritrea (97.2%, a difference of 0.030%).
| Demographics | Rating | Rank | Nursery School |
| Immigrants | Portugal | 0.0 /100 | #286 | Tragic 97.4% |
| Immigrants | Hong Kong | 0.0 /100 | #287 | Tragic 97.4% |
| Immigrants | Thailand | 0.0 /100 | #288 | Tragic 97.3% |
| Immigrants | St. Vincent and the Grenadines | 0.0 /100 | #289 | Tragic 97.3% |
| Immigrants | Afghanistan | 0.0 /100 | #290 | Tragic 97.3% |
| British West Indians | 0.0 /100 | #291 | Tragic 97.3% |
| Houma | 0.0 /100 | #292 | Tragic 97.3% |
| Malaysians | 0.0 /100 | #293 | Tragic 97.3% |
| Immigrants | Grenada | 0.0 /100 | #294 | Tragic 97.3% |
| Immigrants | Immigrants | 0.0 /100 | #295 | Tragic 97.2% |
| Immigrants | Eritrea | 0.0 /100 | #296 | Tragic 97.2% |
| Immigrants | Cuba | 0.0 /100 | #297 | Tragic 97.2% |
| Central American Indians | 0.0 /100 | #298 | Tragic 97.2% |
| Immigrants | Dominica | 0.0 /100 | #299 | Tragic 97.2% |
| Haitians | 0.0 /100 | #300 | Tragic 97.2% |
Demographics Similar to Scandinavians by Nursery School
In terms of nursery school, the demographic groups most similar to Scandinavians are French (98.6%, a difference of 0.010%), European (98.6%, a difference of 0.010%), Czech (98.6%, a difference of 0.010%), French Canadian (98.6%, a difference of 0.010%), and Croatian (98.6%, a difference of 0.020%).
| Demographics | Rating | Rank | Nursery School |
| Sioux | 100.0 /100 | #26 | Exceptional 98.6% |
| Arapaho | 100.0 /100 | #27 | Exceptional 98.6% |
| Croatians | 100.0 /100 | #28 | Exceptional 98.6% |
| French | 100.0 /100 | #29 | Exceptional 98.6% |
| Europeans | 100.0 /100 | #30 | Exceptional 98.6% |
| Czechs | 100.0 /100 | #31 | Exceptional 98.6% |
| French Canadians | 100.0 /100 | #32 | Exceptional 98.6% |
| Scandinavians | 100.0 /100 | #33 | Exceptional 98.6% |
| Chinese | 100.0 /100 | #34 | Exceptional 98.6% |
| Swiss | 100.0 /100 | #35 | Exceptional 98.6% |
| British | 100.0 /100 | #36 | Exceptional 98.5% |
| Lumbee | 99.9 /100 | #37 | Exceptional 98.5% |
| Italians | 99.9 /100 | #38 | Exceptional 98.5% |
| Latvians | 99.9 /100 | #39 | Exceptional 98.5% |
| Chippewa | 99.9 /100 | #40 | Exceptional 98.5% |